Unlock a world of possibilities! Login now and discover the exclusive benefits awaiting you.
- Qlik Community
- :
- All Forums
- :
- QlikView App Dev
- :
- Data Island and Set Analysis
- Subscribe to RSS Feed
- Mark Topic as New
- Mark Topic as Read
- Float this Topic for Current User
- Bookmark
- Subscribe
- Mute
- Printer Friendly Page
- Mark as New
- Bookmark
- Subscribe
- Mute
- Subscribe to RSS Feed
- Permalink
- Report Inappropriate Content
Data Island and Set Analysis
Hi Team -
I have run into a set analysis issue which I have never came across before. I have the following two tables:
Table:
LOAD * Inline [
Dim, Sales
A, 10
B, 20
C, 30
];
IslandTable:
LOAD * Inline [
ABC, XYZ
1ABC, 1
2ABC, 2
3ABC, 3
4ABC, 4
5ABC, 5
];
And lets say I have to use a pivot table using a dimension from the Island Table with set analysis on the Island table fields
1st Attempt (Doesn't work)
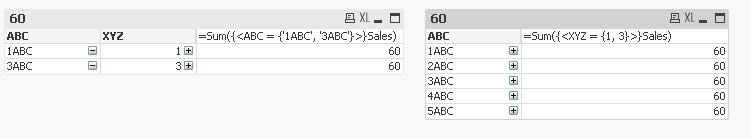
Dimensions: ABC, Dim
Expression: =Sum({<ABC = {'1ABC', '3ABC'}>}Sales)
2nd Attempt (Doesn't work)
Dimensions: ABC, Dim
Expression: =Sum({<XYZ = {1, 3}>}Sales)
In both the above two cases, I hoped to see two rows, but for some reason I saw all ABC

3rd Attempt (Works)
Dimensions: ABC, XYZ, Dim
Expression: =Sum({<ABC = {'1ABC', '3ABC'}>}Sales)
4th Attempt (Works)
Dimensions: ABC, XYZ, Dim
Expression: =Sum({<XYZ = {1, 3}>}Sales)
In my 3rd and 4th attempt, the set analysis starts to work as soon as I add XYZ as dimension (and XYZ is not collapsed)
Is this expected behavior?
swuehl, gwassenaar, mrkachhiaimp, johnw, troyansky, hic, jagan, vinieme12, petter-s, rwunderlich, marcowedel
- « Previous Replies
- Next Replies »
- Mark as New
- Bookmark
- Subscribe
- Mute
- Subscribe to RSS Feed
- Permalink
- Report Inappropriate Content
I meant that should you implement a solution which based on the use of a data-island like in your example respectively the version from Stefan that you give a short feedback to the performance of them compared with a pick(match()) approach then I would be interested how it behaved on a larger dataset and if it could be a real alternative approach to pick(match()).
- Marcus
- Mark as New
- Bookmark
- Subscribe
- Mute
- Subscribe to RSS Feed
- Permalink
- Report Inappropriate Content
Oh ya for sure. I will let you know what I find. But let me say this before hand that the scenario is slightly more complex and I might not get the best possible comparison. This is not because of the amount of data, but because of the complexity of the actual expression itself.
I will try to get back on this sometime during the weekend.
Best,
Sunny
- Mark as New
- Bookmark
- Subscribe
- Mute
- Subscribe to RSS Feed
- Permalink
- Report Inappropriate Content
I have a strong feeling that there is a bug that causes the different behavior between these 4 examples.
In data models where the two tables are associated, applying Set Analysis to the Expression also causes limiting the associated Dimension values to those that produce non-zero Expression results. In this case, however, the two tables are not associated, therefore Set Analysis in the expression should do nothing to the available set of dimensions. I agree with John, that I'd expect all 5 lines with 60 in each line. I believe that the fact that it is different when both Dimensions are present, is caused by a bug.
When I see an example like this, I'm trying to understand the business need behind this logic, and to find a different solution that would not be impacted by the same bug. Sunny - what's the business need here?
cheers,
Oleg Troyansky
- Mark as New
- Bookmark
- Subscribe
- Mute
- Subscribe to RSS Feed
- Permalink
- Report Inappropriate Content
Oleg - thanks for your response. This actually came up when I was trying to help a friend figure something out. I don't fully know the reason behind the requirement, but from what I understand he has 5 options (1ABC, 2ABC, 3ABC, 4ABC, 5ABC) available in a Island Table and for this particular chart he only needs to show 3 of those (1ABC, 3ABC, 5 ABC). Now each of these pull value uses an expression which uses a different field from the database. For instance 1ABC uses 1ABCGrowth, 3ABC uses 3ABCGrowth. I guess I should have thought about using Pick(Match()) or another way to do this, but the expression was so complex that I couldn't even think of that as an option. Having said that, I feel Pick(Match()) or if or may be using Stefan's approach might be the solution that I might work here.
Best,
Sunny
- Mark as New
- Bookmark
- Subscribe
- Mute
- Subscribe to RSS Feed
- Permalink
- Report Inappropriate Content
So in the end I used alternate state where I made selection in 3 of the 5 island table dimension and rest of the filters get driven by inherited state. Details below:
-> Chart is in Alternate State (AS)
-> Expression uses a set analysis like this {$<ABC = AS::ABC, XYZ = AS:XYZ>}
-> Selected 1ABC, 3ABC, 5ABC and locked my selection in alternate state
I had to do the above, because in the inherited state the user can select a single ABC and all my efforts were going in vain because as soon as I select a single ABC, the chart would just show me single ABC, I was somehow unable to ignore selection in ABC or XYZ (I have no idea why this wouldn't work and I would have expected that I might be able to ignore selections).
In the end, it worked, but this would not have been possible without help from you experts.
Thanks,
Sunny
- Mark as New
- Bookmark
- Subscribe
- Mute
- Subscribe to RSS Feed
- Permalink
- Report Inappropriate Content
Hi every one,
I have a excel where we upload monthly data to the existing file with the default dates on the file. The file contains default dates and balance amounts based on a relationship id. I want to calculate the sum of balances every month and also see how much has been increased or decreased from last month updated file. I have 2 years worth of data starting Jan-2016 to Current month(June-2017) data.
Example: I need to calculate all the sum of sales starting Jan-2016 to Jun-2017 sum of sales and also find the difference between the sum of sales between Jan-2016 to Jun-2017 and Jan-2016 to May-2017.. this has to continue every month. i.e. sum of all sales year to date and month to date and difference by -1 month.
Please can some one help me to write the correct syntax for the above description.
=if((sum({<[DEFAULT_DT ])] = {">= $(=Min([DEFAULT_DT ])) < $(=Max([DEFAULT_DT ]]))"}>} and SUM(BALANCE)<0),'(' & '£'& Num(SUM(if(KEY_RANK = 1, BALANCE,0))*(-1)/1000000000 ,'#,##0.00'),
'£'& Num(SUM(if(KEY_RANK = 1, BALANCE,0))/1000000000,'#,##0.00')) & 'bn' & ')'
- « Previous Replies
- Next Replies »