Unlock a world of possibilities! Login now and discover the exclusive benefits awaiting you.
- Qlik Community
- :
- All Forums
- :
- QlikView App Dev
- :
- Data for multiple date fields to be displayed in a...
- Subscribe to RSS Feed
- Mark Topic as New
- Mark Topic as Read
- Float this Topic for Current User
- Bookmark
- Subscribe
- Mute
- Printer Friendly Page
- Mark as New
- Bookmark
- Subscribe
- Mute
- Subscribe to RSS Feed
- Permalink
- Report Inappropriate Content
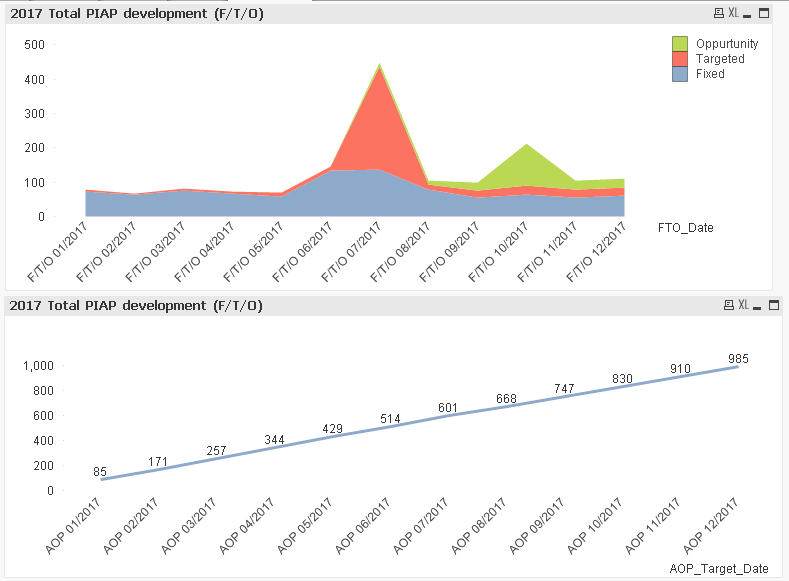
Data for multiple date fields to be displayed in a single line chart.
Hello everyone,
I have a requirement where the data is being pulled from excel sheet and the format is as follows: AOP and Forecast are in the format as shown in the attached screenshot. I have used the cross table concept and have brought in the month columns under one field. Now what I am trying to do is, create a line chart for forecast for F/T/O values that is in the excel sheet like shown in the picture which is related to months under forecast. Similarly we need to have a target AOP trend in the same chart (cumulative), but that corresponds to months under AOP. I am able to show two different graphs for this but unable to combine them under one. How can I achieve this? Is it possible?
Note: At the script side I have loaded months that come under forecast as one table using cross table concept and similarly have also created a separate table for months that come under AOP as shown below.
Forecast:
CrossTable(FTO_Date, Data, 1)
LOAD [Action No],
[F/T/O 01/2017],
[F/T/O 02/2017],
[F/T/O 03/2017],
[F/T/O 04/2017],
[F/T/O 05/2017],
[F/T/O 06/2017],
[F/T/O 07/2017],
[F/T/O 08/2017],
[F/T/O 09/2017],
[F/T/O 10/2017],
[F/T/O 11/2017],
[F/T/O 12/2017]
FROM
...
AOP_Targets:
CrossTable(AOP_Target_Date, AOP_Targets_Data, 1)
LOAD [Action No],
[AOP 01/2017],
[AOP 02/2017],
[AOP 03/2017],
[AOP 04/2017],
[AOP 05/2017],
[AOP 06/2017],
[AOP 07/2017],
[AOP 08/2017],
[AOP 09/2017],
[AOP 10/2017],
[AOP 11/2017],
[AOP 12/2017]
FROM
...
Any suggestions on this?
Thank you.
- Mark as New
- Bookmark
- Subscribe
- Mute
- Subscribe to RSS Feed
- Permalink
- Report Inappropriate Content
Hi,
Sample in Excel
- Mark as New
- Bookmark
- Subscribe
- Mute
- Subscribe to RSS Feed
- Permalink
- Report Inappropriate Content
Hi,
Have you tried with Combo Chart (Hope two tables are getting related)..?
- Mark as New
- Bookmark
- Subscribe
- Mute
- Subscribe to RSS Feed
- Permalink
- Report Inappropriate Content
Yes, the two tables are related