Unlock a world of possibilities! Login now and discover the exclusive benefits awaiting you.
- Qlik Community
- :
- All Forums
- :
- QlikView App Dev
- :
- Re: Display user for all possible dates
- Subscribe to RSS Feed
- Mark Topic as New
- Mark Topic as Read
- Float this Topic for Current User
- Bookmark
- Subscribe
- Mute
- Printer Friendly Page
- Mark as New
- Bookmark
- Subscribe
- Mute
- Subscribe to RSS Feed
- Permalink
- Report Inappropriate Content
Display user for all possible dates
Hi All,
I have data as in table1 and want to display user across each date(as table 2).
eg.: 'a' is present at two different time stamps on 10/10/2017. But I need to display only once across 10/10/2017
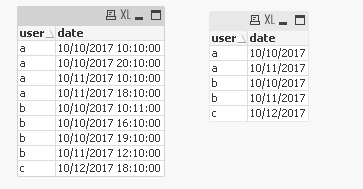
Please let me know how this can be possible at script end and in chart expressions.
Accepted Solutions
- Mark as New
- Bookmark
- Subscribe
- Mute
- Subscribe to RSS Feed
- Permalink
- Report Inappropriate Content
That could be if your date field is not really a date but string. Try using parsing function date#(), like :
Load
user,
Date(Floor(date#(date,'DD/MM/YYYY hh:mm:ss'))) as NewDate
Note: Check the date format and change if required.
- Mark as New
- Bookmark
- Subscribe
- Mute
- Subscribe to RSS Feed
- Permalink
- Report Inappropriate Content
Use DISTINCT after Load statement like
Load DISTINCT F1, F2, .....
- Mark as New
- Bookmark
- Subscribe
- Mute
- Subscribe to RSS Feed
- Permalink
- Report Inappropriate Content
Create a Date field in the script using floor() like:
Load
user,
Date(Floor(date)) as NewDate
Now if you take this user and NewDate in the table box, it should give your expected output.
- Mark as New
- Bookmark
- Subscribe
- Mute
- Subscribe to RSS Feed
- Permalink
- Report Inappropriate Content
Got null values in date column
- Mark as New
- Bookmark
- Subscribe
- Mute
- Subscribe to RSS Feed
- Permalink
- Report Inappropriate Content
That could be if your date field is not really a date but string. Try using parsing function date#(), like :
Load
user,
Date(Floor(date#(date,'DD/MM/YYYY hh:mm:ss'))) as NewDate
Note: Check the date format and change if required.
- Mark as New
- Bookmark
- Subscribe
- Mute
- Subscribe to RSS Feed
- Permalink
- Report Inappropriate Content
Thanks. it worked