Unlock a world of possibilities! Login now and discover the exclusive benefits awaiting you.
- Qlik Community
- :
- All Forums
- :
- QlikView App Dev
- :
- Graph for a Bill of Quantities Table with Start an...
- Subscribe to RSS Feed
- Mark Topic as New
- Mark Topic as Read
- Float this Topic for Current User
- Bookmark
- Subscribe
- Mute
- Printer Friendly Page
- Mark as New
- Bookmark
- Subscribe
- Mute
- Subscribe to RSS Feed
- Permalink
- Report Inappropriate Content
Graph for a Bill of Quantities Table with Start and End Dates
Hello,
I am new to Qlik and am looking for some help on the following.
I have a Bill of Quantities Table (in excel) with line tasks that have a total Value and start and end dates.
I have made a very simple example below:
| Vessel | Task | Day Rate [$] | Days | Total Cost [$] | Date Start | Date Finish |
|---|---|---|---|---|---|---|
| Coastal Warrior | Mobilisation | 1,000 | 14 | 14,000 | 01-01-2017 | 15-01-2017 |
| Coastal Warrior | Working | 2,000 | 20 | 40,000 | 15-1-2017 | 04-02-2017 |
| Coastal Warrior | De-Mobilisation | 1,000 | 5 | 5,000 | 04-02-2017 | 09-02-2017 |
| Coastal Warrior | Crew | 1,000 | 39 | 39,000 | 01-01-2017 | 09-02-2017 |
So HOW would I like to build a line graph (essentially an s-curve -> as Primavera would do) with:
X-axis Dimension - Date (by day)
Y-Axis Measure - Cumulative costs of all activities associated with each date
Eg. on the 01-01-2017 = total cost = $2000 -> $1000 (Vessel Mob 1 day) + $1000 (crew for 1 day)
So on the final day 09-02-2017 the measure would be $98,000.
Many thanks,
Rob
- Mark as New
- Bookmark
- Subscribe
- Mute
- Subscribe to RSS Feed
- Permalink
- Report Inappropriate Content
Check out the attached
Script
Table:
LOAD *,
Date(Date_Start + IterNo() - 1) as Date
While Date_Start + IterNo() - 1 < Date_Finish;
LOAD * INLINE [
Vessel, Task, Day_Rate, Days, Total_Cost, Date_Start, Date_Finish
Coastal Warrior, Mobilisation, "1,000", 14, "14,000", 01-01-2017, 15-01-2017
Coastal Warrior, Working, "2,000", 20, "40,000", 15-01-2017, 04-02-2017
Coastal Warrior, De-Mobilisation, "1,000", 5, "5,000", 04-02-2017, 09-02-2017
Coastal Warrior, Crew, "1,000", 39, "39,000", 01-01-2017, 09-02-2017
];
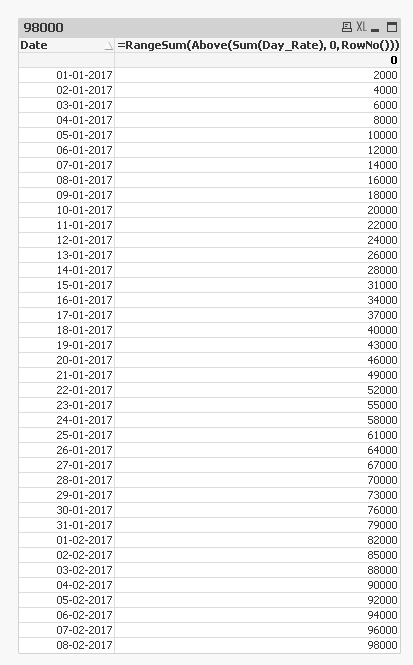
Chart
Dimension
Date
Expression
=RangeSum(Above(Sum(Day_Rate), 0, RowNo()))