Unlock a world of possibilities! Login now and discover the exclusive benefits awaiting you.
- Qlik Community
- :
- All Forums
- :
- QlikView App Dev
- :
- Re: Help me in displaying bars based on input valu...
- Subscribe to RSS Feed
- Mark Topic as New
- Mark Topic as Read
- Float this Topic for Current User
- Bookmark
- Subscribe
- Mute
- Printer Friendly Page
- Mark as New
- Bookmark
- Subscribe
- Mute
- Subscribe to RSS Feed
- Permalink
- Report Inappropriate Content
Help me in displaying bars based on input value?
Hi All,
I have one bar chart with one dimension "countyname" having 30 countries.
Now my challenge is to display number of countries in chart based on input value in chart.
How can I use "text in chart" in presentation tab to display particular number of countries.
ex: if i gave 10 as input value in chart then it will show 10 bars. suppose if i gave 5 as input then it will show 5 bars.
NOTE: All this need to be implement in chart itself. so i am planning to use text in chart option in presentation.
This is highly appreciated.
Thanks,
Durga
- « Previous Replies
-
- 1
- 2
- Next Replies »
Accepted Solutions
- Mark as New
- Bookmark
- Subscribe
- Mute
- Subscribe to RSS Feed
- Permalink
- Report Inappropriate Content
- Mark as New
- Bookmark
- Subscribe
- Mute
- Subscribe to RSS Feed
- Permalink
- Report Inappropriate Content
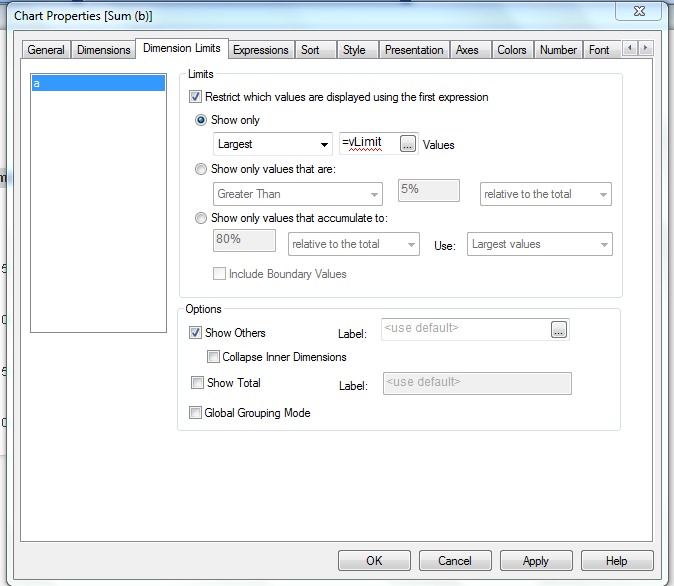
Charts don't have input boxes. What you can do is use an input box to set the value of a variable and use that variable in your chart on the Dimension Limits tab to limit the number of bars shown. See attached example
talk is cheap, supply exceeds demand
- Mark as New
- Bookmark
- Subscribe
- Mute
- Subscribe to RSS Feed
- Permalink
- Report Inappropriate Content
Thank you for your response Gysbert!
Dont mind! please share screenshots. I have no access to qvw's due to security reasons.
waiting for reply!
Thanks,
Durga
- Mark as New
- Bookmark
- Subscribe
- Mute
- Subscribe to RSS Feed
- Permalink
- Report Inappropriate Content
Hi Durga,
Actually Text in Chart is only for showing something in chart.
We can't take the value from this option.
We can only show the info in chart using this option.
So you can use Input Box/Slider for that functionality.
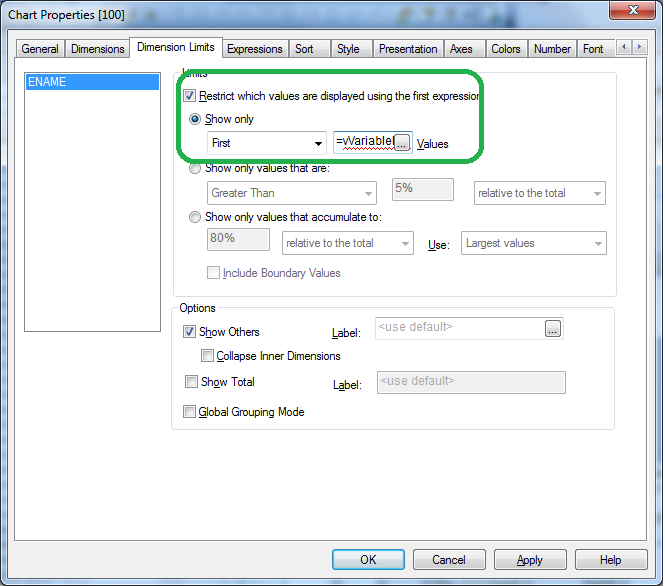
You can use a variable in input box and can set the value of that variable with any input value and then use that variable in Chart's Dimension Limit Property to limit the no of values shown in chart.
Thanks & Regards
Prince Anand
- Mark as New
- Bookmark
- Subscribe
- Mute
- Subscribe to RSS Feed
- Permalink
- Report Inappropriate Content
- Mark as New
- Bookmark
- Subscribe
- Mute
- Subscribe to RSS Feed
- Permalink
- Report Inappropriate Content
goto Chart Properties - Dimension Limit - Enable Restrict ... - Show Only - Largest Values..
- Mark as New
- Bookmark
- Subscribe
- Mute
- Subscribe to RSS Feed
- Permalink
- Report Inappropriate Content
Thanks Gysbert, anand for your suggestions. I am cleared for your inputs.
@ anand: Can i define variable as 0 by default.
- Mark as New
- Bookmark
- Subscribe
- Mute
- Subscribe to RSS Feed
- Permalink
- Report Inappropriate Content
Try like this
Chart Properties -> Dimension Limits ->
 Hi,
Hi,
- Mark as New
- Bookmark
- Subscribe
- Mute
- Subscribe to RSS Feed
- Permalink
- Report Inappropriate Content
Hi,
using gwassenaar solution, you could position the input box on top of the chart.
Unchecking the "show caption" and "use borders" options would seamlessly integrate the input box into the chart:
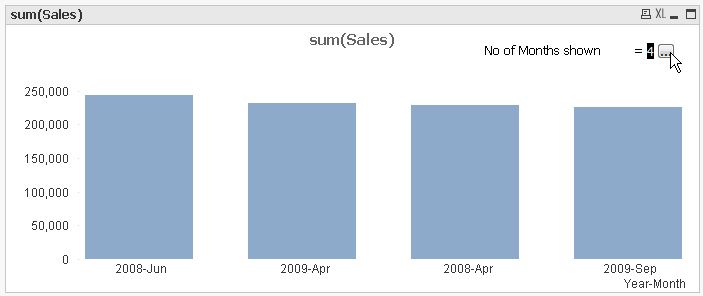
hope this helps
regards
Marco
- Mark as New
- Bookmark
- Subscribe
- Mute
- Subscribe to RSS Feed
- Permalink
- Report Inappropriate Content
Super Marco! Its working! Great Idea..
This is the output i want!
- « Previous Replies
-
- 1
- 2
- Next Replies »