Unlock a world of possibilities! Login now and discover the exclusive benefits awaiting you.
- Qlik Community
- :
- All Forums
- :
- QlikView App Dev
- :
- How to create 100% stacked columns with absolute n...
Options
- Subscribe to RSS Feed
- Mark Topic as New
- Mark Topic as Read
- Float this Topic for Current User
- Bookmark
- Subscribe
- Mute
- Printer Friendly Page
Turn on suggestions
Auto-suggest helps you quickly narrow down your search results by suggesting possible matches as you type.
Showing results for
Anonymous
Not applicable
2016-01-26
08:58 AM
- Mark as New
- Bookmark
- Subscribe
- Mute
- Subscribe to RSS Feed
- Permalink
- Report Inappropriate Content
How to create 100% stacked columns with absolute number
Hello!
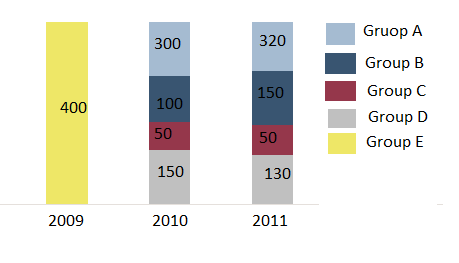
I need to create the chart as shown: columns have the same height, but they show different values segmented by Groups. Is it possible?
Id est, I would like to replace the percentage with the absolute values, keeping the proportion of the percentage.

Thanks!
Elena
1,172 Views
1 Solution
Accepted Solutions
MVP
2016-01-26
09:27 AM
- Mark as New
- Bookmark
- Subscribe
- Mute
- Subscribe to RSS Feed
- Permalink
- Report Inappropriate Content
1,105 Views
4 Replies
MVP
2016-01-26
09:00 AM
- Mark as New
- Bookmark
- Subscribe
- Mute
- Subscribe to RSS Feed
- Permalink
- Report Inappropriate Content
May be make use of Dual() function. Something like this:
Dual(Sum(Field), Sum(Field), Sum(Total <Year> Field))
May be share a sample for more help.
Anonymous
Not applicable
2016-01-26
09:25 AM
Author
- Mark as New
- Bookmark
- Subscribe
- Mute
- Subscribe to RSS Feed
- Permalink
- Report Inappropriate Content
Thank you, but I think it doesn't work...
I attched example files.
Thanks!
Elena
1,105 Views
MVP
2016-01-26
09:27 AM
- Mark as New
- Bookmark
- Subscribe
- Mute
- Subscribe to RSS Feed
- Permalink
- Report Inappropriate Content
This?
1,106 Views
Anonymous
Not applicable
2016-01-26
09:52 AM
Author
- Mark as New
- Bookmark
- Subscribe
- Mute
- Subscribe to RSS Feed
- Permalink
- Report Inappropriate Content
Yes, thanks, you are very kind!
Elena