Unlock a world of possibilities! Login now and discover the exclusive benefits awaiting you.
- Qlik Community
- :
- All Forums
- :
- QlikView App Dev
- :
- How to display event labels on a timeline
- Subscribe to RSS Feed
- Mark Topic as New
- Mark Topic as Read
- Float this Topic for Current User
- Bookmark
- Subscribe
- Mute
- Printer Friendly Page
- Mark as New
- Bookmark
- Subscribe
- Mute
- Subscribe to RSS Feed
- Permalink
- Report Inappropriate Content
How to display event labels on a timeline
I have data of the following form:
username, event1, event2, event3, event4
events are timestamps, e.g. '2014-11-07 11:13:00'
deltas are all the same; e.g. if I know event1, then I know event2 is + x hours, etc.
So really, I have just username, starttime and formulas that define subsequent events.
(I anticipate the requirements will become more complex as we receive actual observed times from event2-4 and are asked to display deviation, averages, etc. from meeting the planned timeline)
The goal is to plot continuous real time on the X-axis for a given window of time such as +/-15 days from now() and then display points for each username labeled as event1, event2, event3, etc. Ideally, we want a horizontal bar indicating progression through the events.
Perhaps this is a simplified gantt chart?
I want to display the text, "event1" instead of the value of the data point. Here is my rough starting point:
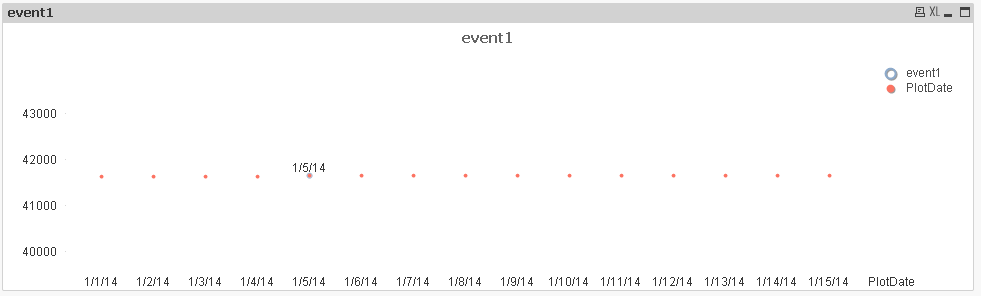
The Y axis will not be meaningful; it will just usernames with each user's timeline to the right.
I found the example here for a Gantt chart
Files for creation of a Gantt chart
but I do not see how to get the labeling I want. Here is a rough sketch of what I want. Of course, the design is evolving...
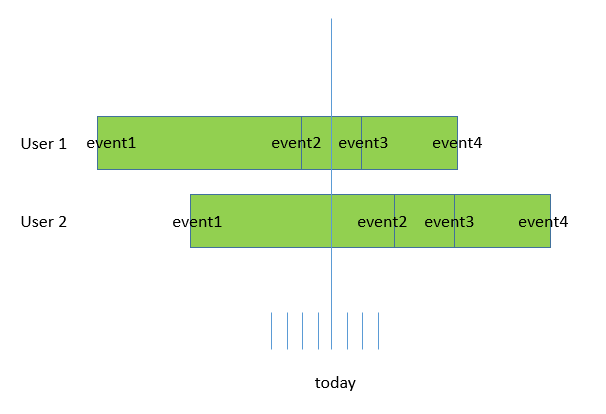
Message was edited by: David Atkins posting sample test data. Another approach we have tried is to calculate the delta time values and then plot that as a stacked bar so the origin is arrival date. One of the objectives behind this dashboard is to identify accounts that are falling outside the projected event times. So for each account, you know from the arrival date there is a projected bed, lab, and discharge date. Then, you get data for the actual times. What you are interested in is seeing accounts that take longer to process than they are projected.
- Mark as New
- Bookmark
- Subscribe
- Mute
- Subscribe to RSS Feed
- Permalink
- Report Inappropriate Content
please post sample app/data