Unlock a world of possibilities! Login now and discover the exclusive benefits awaiting you.
- Qlik Community
- :
- All Forums
- :
- QlikView App Dev
- :
- How to find gap using ranks
- Subscribe to RSS Feed
- Mark Topic as New
- Mark Topic as Read
- Float this Topic for Current User
- Bookmark
- Subscribe
- Mute
- Printer Friendly Page
- Mark as New
- Bookmark
- Subscribe
- Mute
- Subscribe to RSS Feed
- Permalink
- Report Inappropriate Content
How to find gap using ranks
Hi,
I have a requirement to show revenue gap using revenue and cost ranks.. In below example, client h needs to make additional $570.9695744 to reach to no. 1 revenue rank position... formula is - 983.3415781 - 412.3720037 = 570.9695744
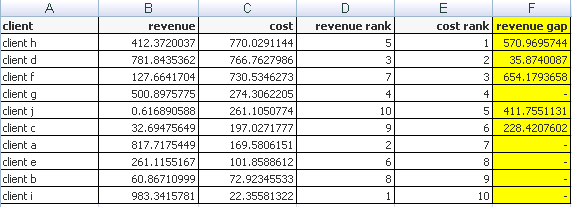
if a client's revenue rank is already better than its cost rank, then we don't need to calculate revenue gap..
Looking for any advise to build this type of chart... i don't want to pre calculate as the calculations need to happen at run time based on selected filters...
appreciate any suggestions... thanks!
- « Previous Replies
-
- 1
- 2
- Next Replies »
- Mark as New
- Bookmark
- Subscribe
- Mute
- Subscribe to RSS Feed
- Permalink
- Report Inappropriate Content
You can generate that too if you like:
if(rank(sum(revenue))>rank(sum(cost)),
rangesum(
pick(rank(sum(cost)),
$(=concat( 'max(total aggr(sum(revenue),client),' &
num(ValueLoop(1,GetPossibleCount(client)),'00') & ')' &chr(10) ,',' ))
),
-sum(revenue)
)
)
talk is cheap, supply exceeds demand
- Mark as New
- Bookmark
- Subscribe
- Mute
- Subscribe to RSS Feed
- Permalink
- Report Inappropriate Content
thanks Gysbert! the solution works fine!
my only concern is performance... for more then 1000 clients, it takes a while to calculate... am thinking of adding a condition to show chart data only when applicable list of clients is below 1000...
thanks again... really appreciate your help with this... !
- « Previous Replies
-
- 1
- 2
- Next Replies »