Unlock a world of possibilities! Login now and discover the exclusive benefits awaiting you.
- Qlik Community
- :
- All Forums
- :
- QlikView App Dev
- :
- Re: How to find the last occurrence in a time peri...
- Subscribe to RSS Feed
- Mark Topic as New
- Mark Topic as Read
- Float this Topic for Current User
- Bookmark
- Subscribe
- Mute
- Printer Friendly Page
- Mark as New
- Bookmark
- Subscribe
- Mute
- Subscribe to RSS Feed
- Permalink
- Report Inappropriate Content
How to find the last occurrence in a time period ?
I have [income]- (REVENUE) table of accounts, each account can have multiple instances in a year ( and in a Quarter and in a Month ) . how can I find the last occurrence of all the accounts in a time period (and then summarize all of these latest occurrences) ?
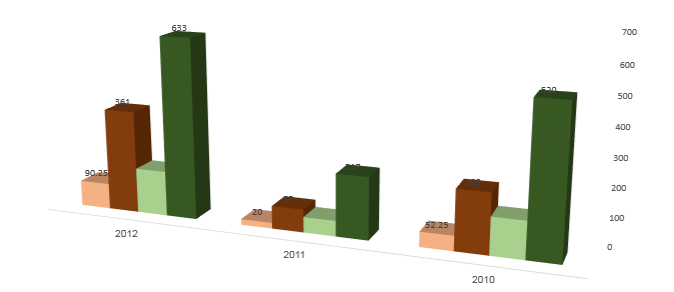
i need something like the chart below : the dark green is the sum of the first revenue for each account in a year ( the dark brown is the last ...).
the model contain fact table , dimension scd2 table ( and translate colors table ) - see attached file.
thanks!
- Tags:
- last occurrence scd2
- Mark as New
- Bookmark
- Subscribe
- Mute
- Subscribe to RSS Feed
- Permalink
- Report Inappropriate Content
Look up the FirstSortedValue function in the help file. It sounds like that's what you're looking for. If you need more help then please post a small qlikview document that illustrates the problem.
talk is cheap, supply exceeds demand
- Mark as New
- Bookmark
- Subscribe
- Mute
- Subscribe to RSS Feed
- Permalink
- Report Inappropriate Content
Hi ,
How did you create this , its looking awesome look, If you don't mine Can you share sample app .?
- Mark as New
- Bookmark
- Subscribe
- Mute
- Subscribe to RSS Feed
- Permalink
- Report Inappropriate Content
hi subbareddykm , its from tabular-model , we are trying to see the ability of QV to produce a similar aggr members. thanks.
- Mark as New
- Bookmark
- Subscribe
- Mute
- Subscribe to RSS Feed
- Permalink
- Report Inappropriate Content
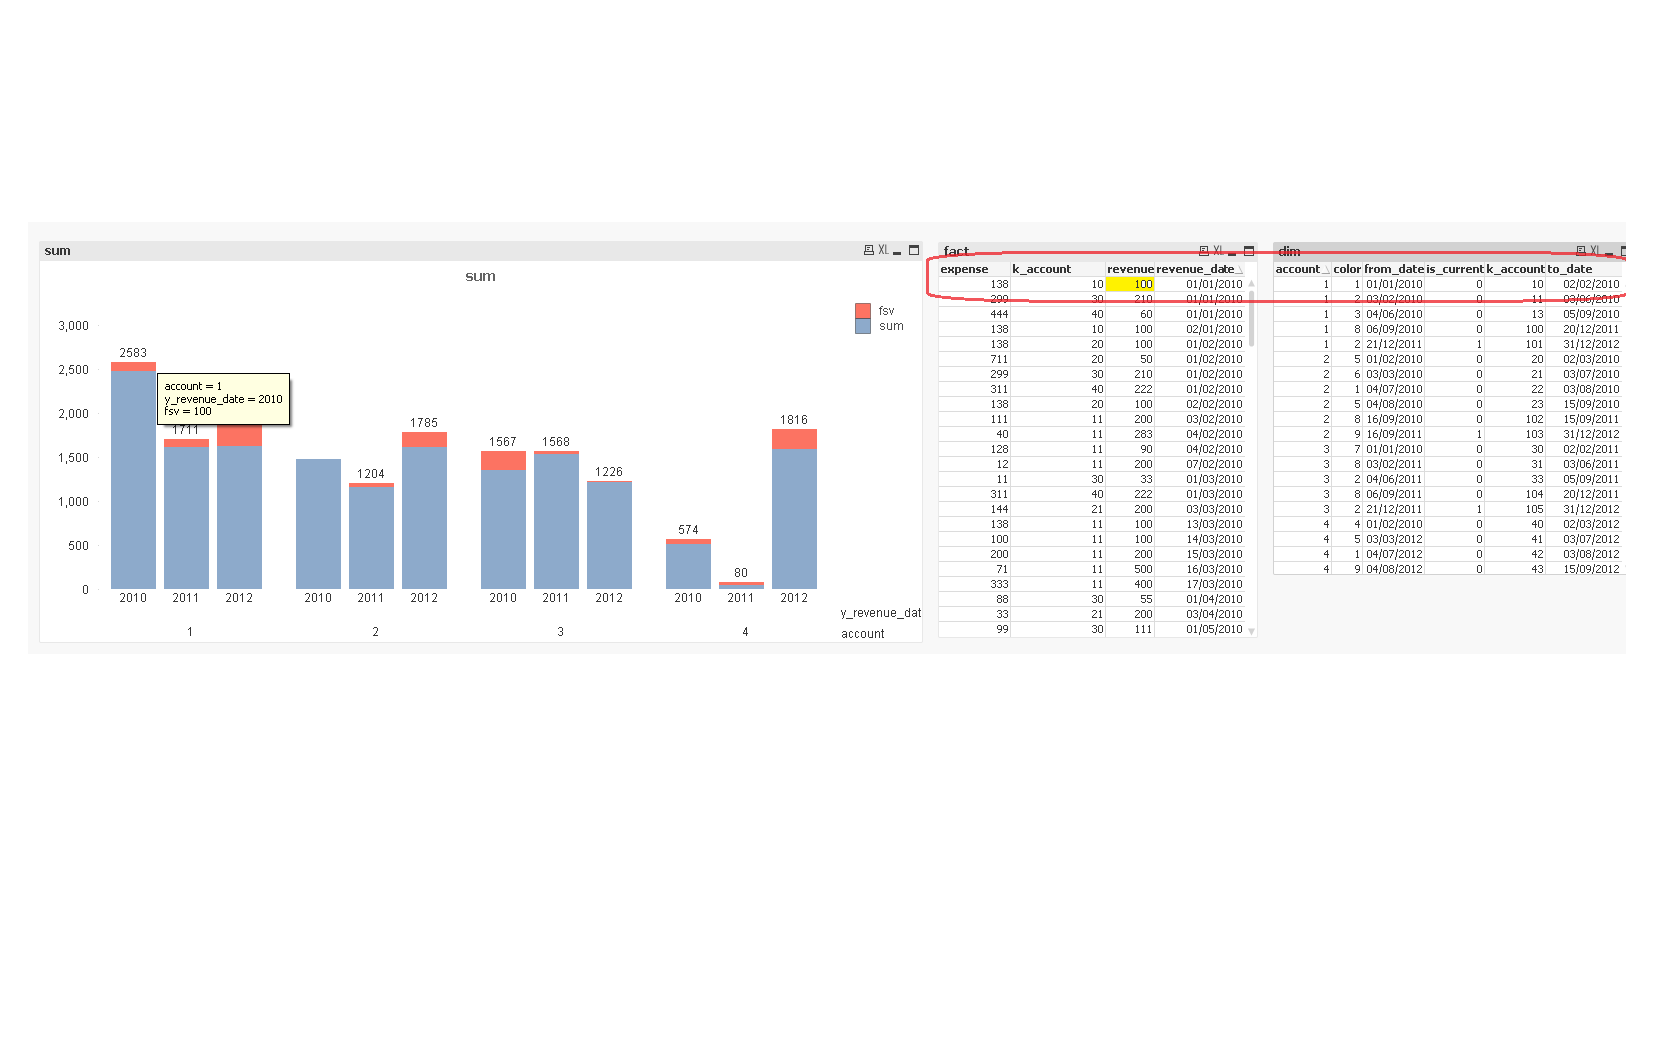
hi Gysbert , i did try to use the function and i got nise result as you can see below ,
but if i want to sum the first occurrence of all the accounts in a time period of a year by using
fsv = ( FirstSortedValue(revenue,revenue_date) ) something goes wrong and i get empty result ,
i need to insert the account factor but how to do it i steel dont know, if tou or any body have a way to solve this it will be great , thanks and sorry about the small image.
- Mark as New
- Bookmark
- Subscribe
- Mute
- Subscribe to RSS Feed
- Permalink
- Report Inappropriate Content
You probably want to sum a list of fsv results. That's an aggregation of a list of aggregations, so you need to use the aggr function: sum(aggr(FirstSortedValue(revenue, revenuedate), account))
talk is cheap, supply exceeds demand
- Mark as New
- Bookmark
- Subscribe
- Mute
- Subscribe to RSS Feed
- Permalink
- Report Inappropriate Content
Hi Gysbert , you are very helpfull ! thanks ,
i added the year of revenue_date because i need the this dimension on the chart and its work  :
:
= sum ( aggr(FirstSortedValue(revenue, revenue_date), account , y_revenue_date ) ) ,
I wonder if we can do the calculation dynamically - so we can change the level of the year to quarter or month, and we'll still get the desired result..
any way I learned from you a lot.