Unlock a world of possibilities! Login now and discover the exclusive benefits awaiting you.
- Qlik Community
- :
- All Forums
- :
- QlikView App Dev
- :
- Re: How to pick up last week's data of that partic...
- Subscribe to RSS Feed
- Mark Topic as New
- Mark Topic as Read
- Float this Topic for Current User
- Bookmark
- Subscribe
- Mute
- Printer Friendly Page
- Mark as New
- Bookmark
- Subscribe
- Mute
- Subscribe to RSS Feed
- Permalink
- Report Inappropriate Content
How to pick up last week's data of that particular month in QlikView?
Hello Everyone,
I need help on the below requirement.
I have a date field which has dates of only Fridays of that particular month. So this field will have 4 or 5 date values for a month based on number of Fridays in that month. What I want to achieve is, there are AOP and Actual figures against these dates, and in my straight table I would like to display only the data of last week in that particular month. And for the current month, data should be the latest week data.
For Example: Considering that below is the table in excel sheet, I want to display only data for AOP and Actuals for Date, 25-08-2017 for month of August and for September, I have to show data for Date, 01-09-2017 as this is the latest week in September so far.
| Date | AOP | Actuals |
|---|---|---|
| 04-08-2017 | 755 | 585 |
| 11-08-2017 | 389 | 54 |
| 18-08-2017 | 876 | 766 |
| 25-08-2017 | 256 | 86 |
| 01-09-2017 | 784 | 233 |
| 08-09-2017 | 265 | - |
| 15-09-2017 | 987 | - |
How can I show this data in a Straight table? Any suggestions?
Thank you.
- « Previous Replies
-
- 1
- 2
- Next Replies »
- Mark as New
- Bookmark
- Subscribe
- Mute
- Subscribe to RSS Feed
- Permalink
- Report Inappropriate Content
Create a Month field in the script. Then try like:
Chart Dimension: =Aggr( Max(If(Date<=Today(), Date)), Month)
- Mark as New
- Bookmark
- Subscribe
- Mute
- Subscribe to RSS Feed
- Permalink
- Report Inappropriate Content
The simplest way is to add last Friday flag in the load script like this:
// Load fact table
Fact:
LOAD Date,
AOP,
Actuals,
...
FROM ...
//Add last Friday flag
Left Join (Fact)
LOAD Max(Date) as Date
1 as LastFridayFlag
Resident Fact
Group By MonthName(Date);
- Mark as New
- Bookmark
- Subscribe
- Mute
- Subscribe to RSS Feed
- Permalink
- Report Inappropriate Content
Hi Jonathan,
Thanks for your suggestion and this is close to what I want. I see that only last date of that particular month is being picked up which is fine, but I also want the following condition to be satisfied, i.e., for current month, data for latest week has to be picked. Here in my case, the straight table has to show data for 01-09-2017 for now, as this is the latest week so far for September. But in QlikView I see data for 29-09-2017 as this is the last week in this month.
- Mark as New
- Bookmark
- Subscribe
- Mute
- Subscribe to RSS Feed
- Permalink
- Report Inappropriate Content
Hi Tresesco,
I tried your suggestion and I am getting partial result. What I mean is, for few dates I do not see AOP values as you can see in the below picture. I am checking what could be the issue. Let me know if you have any idea why?

Thank you.
- Mark as New
- Bookmark
- Subscribe
- Mute
- Subscribe to RSS Feed
- Permalink
- Report Inappropriate Content
Could you share your sample data?
- Mark as New
- Bookmark
- Subscribe
- Mute
- Subscribe to RSS Feed
- Permalink
- Report Inappropriate Content
Attached is the sample data.
Since AOP figures have same data for all the weeks, I am able to fetch this data in QlikView. But as Actual vary for each week, the data is not seen in the table.
Can you please help with that?
Thank you.
- Mark as New
- Bookmark
- Subscribe
- Mute
- Subscribe to RSS Feed
- Permalink
- Report Inappropriate Content
>> Here in my case, the straight table has to show data for 01-09-2017 for now, as this is the latest week so far for September.
Add a where clause to limit the Max. Perhaps something like
//Add last Friday flag
Left Join (Fact)
LOAD Max(Date) as Date
1 as LastFridayFlag
Resident Fact
Group By MonthName(Date)
Where Sum(AOP) > 0;
- Mark as New
- Bookmark
- Subscribe
- Mute
- Subscribe to RSS Feed
- Permalink
- Report Inappropriate Content
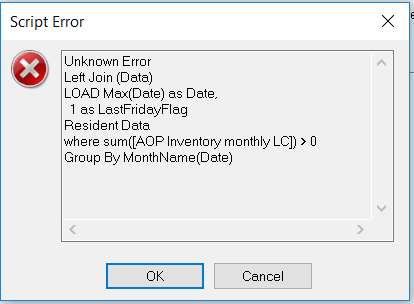
I am getting an unknown error when tried to execute the script with this code!
- Mark as New
- Bookmark
- Subscribe
- Mute
- Subscribe to RSS Feed
- Permalink
- Report Inappropriate Content
In 9/1/2017, you don't have data for ACT. What do you expect to see for it, null or the previous available data ?
- « Previous Replies
-
- 1
- 2
- Next Replies »