Unlock a world of possibilities! Login now and discover the exclusive benefits awaiting you.
- Qlik Community
- :
- All Forums
- :
- QlikView App Dev
- :
- Re: How to stop this weird behaviour!!
- Subscribe to RSS Feed
- Mark Topic as New
- Mark Topic as Read
- Float this Topic for Current User
- Bookmark
- Subscribe
- Mute
- Printer Friendly Page
- Mark as New
- Bookmark
- Subscribe
- Mute
- Subscribe to RSS Feed
- Permalink
- Report Inappropriate Content
How to stop this weird behaviour!!
Hi ,
I am getting this strange behaviour on my QVW.
Figure 1:I have given 3 expressions based on the requirement but in the pie chart i can only see One displaying irrespective of clicking the value on data points in the properties.I will be happy if I can see the remaning values on the chart here.
Figure 2: Now i have to change the expression to something else to get all the values on the pie chart but now the expression is showing when i hover over the chart.I will be happy if it stops the expression not coming onto the chart.
Any help is appreicated.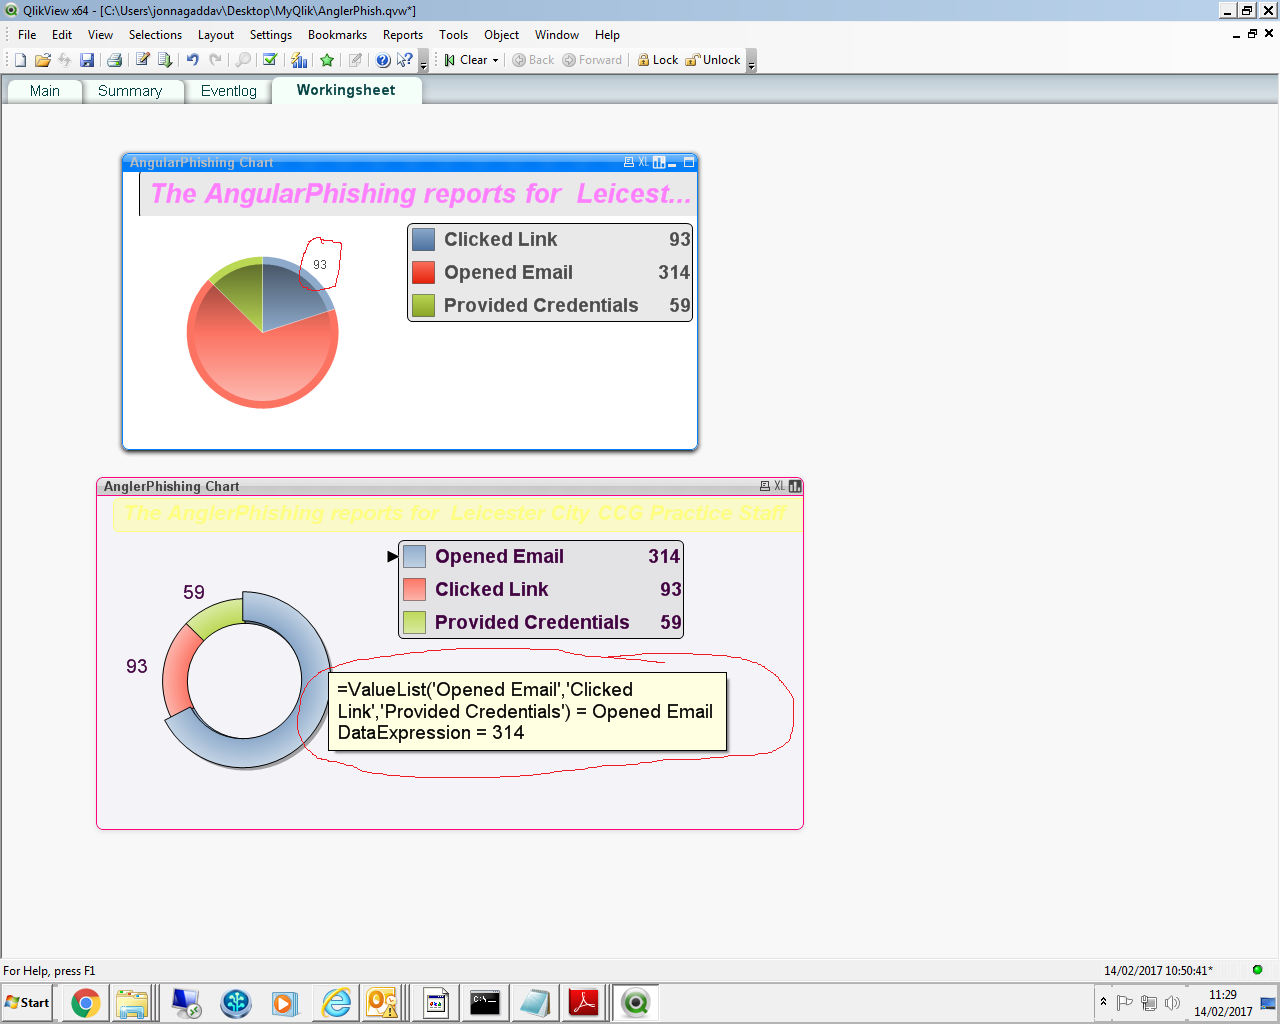
Accepted Solutions
- Mark as New
- Bookmark
- Subscribe
- Mute
- Subscribe to RSS Feed
- Permalink
- Report Inappropriate Content
Hello Vamsi,
Trust that you are doing good!
Figure 2: You can deselect the Pop-up Labels option available under the presentation tab of chart properties.
Hope this will help.
Regards!
Rahul
- Mark as New
- Bookmark
- Subscribe
- Mute
- Subscribe to RSS Feed
- Permalink
- Report Inappropriate Content
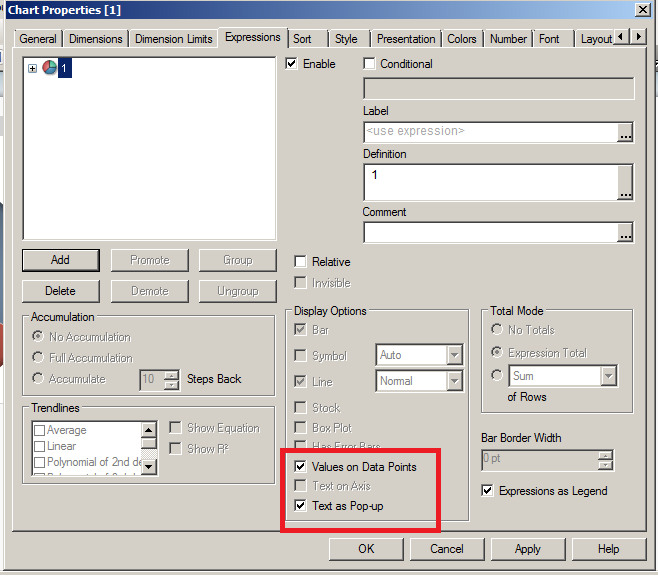 you need to unclick 'values on Data Point' and 'Text as Pop-up'
- Mark as New
- Bookmark
- Subscribe
- Mute
- Subscribe to RSS Feed
- Permalink
- Report Inappropriate Content
I did try but it is still showing .
Are you referring to the figure 1 or Figure 2?
- Mark as New
- Bookmark
- Subscribe
- Mute
- Subscribe to RSS Feed
- Permalink
- Report Inappropriate Content
Hello Vamsi,
Trust that you are doing good!
Figure 2: You can deselect the Pop-up Labels option available under the presentation tab of chart properties.
Hope this will help.
Regards!
Rahul
- Mark as New
- Bookmark
- Subscribe
- Mute
- Subscribe to RSS Feed
- Permalink
- Report Inappropriate Content
You know what I just did and seen your reply.
Perhaps we are on the same wavelength.
smashing.
Thank you rahul.
- Mark as New
- Bookmark
- Subscribe
- Mute
- Subscribe to RSS Feed
- Permalink
- Report Inappropriate Content
Would you be able to share your qvw file to take a look at this?
- Mark as New
- Bookmark
- Subscribe
- Mute
- Subscribe to RSS Feed
- Permalink
- Report Inappropriate Content
Hi Rahul,
In the same way , How shall i allow the chart to display like opened email = number when i hover onto that.!
- Mark as New
- Bookmark
- Subscribe
- Mute
- Subscribe to RSS Feed
- Permalink
- Report Inappropriate Content
Hello Vamsi,
Thank you for the appreciation.
You can add another expression with definition like -
='Opened email = ' & Sum(OpenedEmailCount)
//Take same expression which is used earlier in the pie chart
Once this is done then tick the Text as Pop-up check box present under the display option on Expression tab.
Regards!
Rahul