Unlock a world of possibilities! Login now and discover the exclusive benefits awaiting you.
- Qlik Community
- :
- All Forums
- :
- QlikView App Dev
- :
- Re: Limit Values on x-Axis
- Subscribe to RSS Feed
- Mark Topic as New
- Mark Topic as Read
- Float this Topic for Current User
- Bookmark
- Subscribe
- Mute
- Printer Friendly Page
- Mark as New
- Bookmark
- Subscribe
- Mute
- Subscribe to RSS Feed
- Permalink
- Report Inappropriate Content
Limit Values on x-Axis

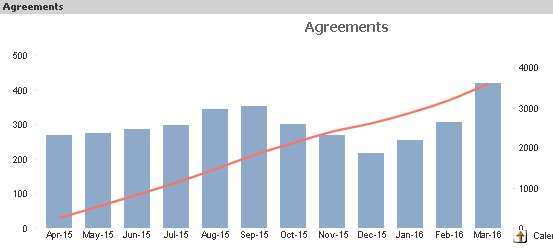
In the above chart it show me all the months from April 15 to Mar 16 however, I want the chart to start displaying data from Aug-15 and continue to go until present.
How do I do that??
Dimension Limit and Continuous in Axes are of no help to me.
Thank You.
Accepted Solutions
- Mark as New
- Bookmark
- Subscribe
- Mute
- Subscribe to RSS Feed
- Permalink
- Report Inappropriate Content
try calculated dimension
if (Calender>='Aug-15',Calender)
more flexible (show last 12 months)
if (Calendar >=date(addmonths(today(),-12),'MMM-YY'), Calendar)
- Mark as New
- Bookmark
- Subscribe
- Mute
- Subscribe to RSS Feed
- Permalink
- Report Inappropriate Content
try calculated dimension
if (Calender>='Aug-15',Calender)
more flexible (show last 12 months)
if (Calendar >=date(addmonths(today(),-12),'MMM-YY'), Calendar)
- Mark as New
- Bookmark
- Subscribe
- Mute
- Subscribe to RSS Feed
- Permalink
- Report Inappropriate Content
I agree the Rudolf
This seems group, try to add calc dimension for the internal calc dim instead of normal dim
- Mark as New
- Bookmark
- Subscribe
- Mute
- Subscribe to RSS Feed
- Permalink
- Report Inappropriate Content
Hi Roopali,
You can use set analysis to achieve this. Create a variable and assign Aug-15 to that variable in variable overview.
eg. vMonthStart = Aug-15
Create a bar chart with month-Year as Dimension and the below expression in set analysis.
Sum({<Month={"$(=(vMonthStart ))"}>} Sales)
- Mark as New
- Bookmark
- Subscribe
- Mute
- Subscribe to RSS Feed
- Permalink
- Report Inappropriate Content
Ram, your expression gives only aug-15 sales only
- Mark as New
- Bookmark
- Subscribe
- Mute
- Subscribe to RSS Feed
- Permalink
- Report Inappropriate Content
Hi
try this
Sum({<Month={">=$(=(Aug-15))"}>} Sales)
Or l
ike this as said by "ram ch "
Sum({<Month={">=$(=(vMonthStart ))"}>} Sales)
- Mark as New
- Bookmark
- Subscribe
- Mute
- Subscribe to RSS Feed
- Permalink
- Report Inappropriate Content
Hi Roopali,
Sorry for the typo. you can try the below.
Sum({<Month={">=$(=(vMonthStart ))"}>} Sales)
- Mark as New
- Bookmark
- Subscribe
- Mute
- Subscribe to RSS Feed
- Permalink
- Report Inappropriate Content
For time period limitation it is often a good approach to define these periods in the data model. This way you can apply the selected range through set expressions, without having a static date in the actual expression. It will also mean that you define and control your flag in one place, making is easier to administer and maintain the application.
If this does not answer your question please provide a sample QVW so that your question can be put in context of your data. Screenshots can sometimes be a bit limited in terms of understanding your chart settings and underlying data.
Please see attach sample as reference to how you can approach controlling the range through a flag in a calendar table.
- Mark as New
- Bookmark
- Subscribe
- Mute
- Subscribe to RSS Feed
- Permalink
- Report Inappropriate Content
The accepted answer works in most circumstances but not where there is a function that relies on the full date range in the chart expression. In this case, the calculation will also only be done over the last 12 months only and it will affect the data.
To solve for this circumstance, add a last x months flag to the calendar and perform the calculation in the chart function using IF this flag = 1. That will limit your date range without affecting the calculation.