Unlock a world of possibilities! Login now and discover the exclusive benefits awaiting you.
- Qlik Community
- :
- All Forums
- :
- QlikView App Dev
- :
- Re: Line Chart Behaviour
- Subscribe to RSS Feed
- Mark Topic as New
- Mark Topic as Read
- Float this Topic for Current User
- Bookmark
- Subscribe
- Mute
- Printer Friendly Page
- Mark as New
- Bookmark
- Subscribe
- Mute
- Subscribe to RSS Feed
- Permalink
- Report Inappropriate Content
Line Chart Behaviour
Hello All,
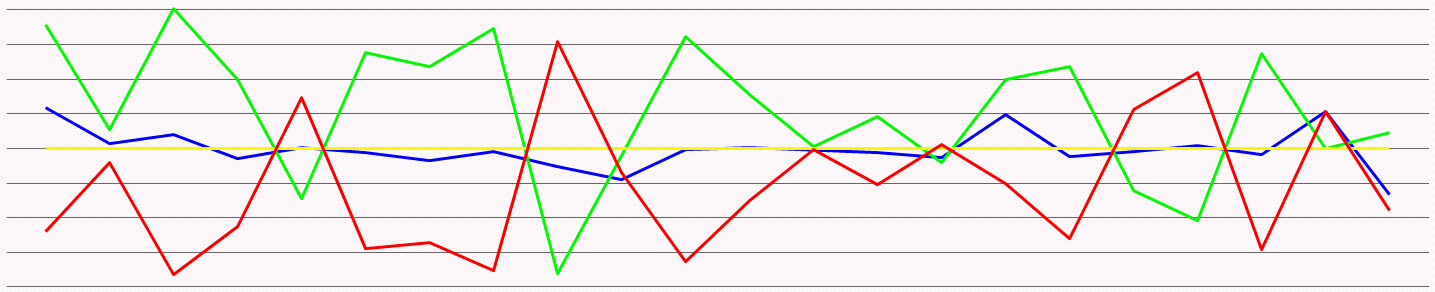
I have a requirement to produce a bell curve graph,
When setting the line style to 'Smooth' the line appears to be going back on itself.
I have had to set the axis to continuous in order to be able to insert vertical reference lines.
Any help in this issue would be appreciated,
Please see the attached,
Thanks
BlockRocker
- « Previous Replies
-
- 1
- 2
- Next Replies »
- Mark as New
- Bookmark
- Subscribe
- Mute
- Subscribe to RSS Feed
- Permalink
- Report Inappropriate Content
Is this what you're looking for?
- Mark as New
- Bookmark
- Subscribe
- Mute
- Subscribe to RSS Feed
- Permalink
- Report Inappropriate Content
When you have "Continues" ticked you will then have the option to tick "Forced 0" then just untick Continues and you should get the required result
- Mark as New
- Bookmark
- Subscribe
- Mute
- Subscribe to RSS Feed
- Permalink
- Report Inappropriate Content
Don't set it to Smooth, set it to normal, the reason is, a value of 1 should be alligned with the other value of 1, is there a specific reason why you want it to look like a Bell Curve?
- Mark as New
- Bookmark
- Subscribe
- Mute
- Subscribe to RSS Feed
- Permalink
- Report Inappropriate Content
Or add a new Expression as =1, this will give you a line at the value 1
- Mark as New
- Bookmark
- Subscribe
- Mute
- Subscribe to RSS Feed
- Permalink
- Report Inappropriate Content
Fantastic Alan, i tried this yesterday and the smoothing was irritating me  . To OP do what Alan suggested, this will allow you to still have bell curve and not as you descriped 'chart going back in itself'
- Mark as New
- Bookmark
- Subscribe
- Mute
- Subscribe to RSS Feed
- Permalink
- Report Inappropriate Content
Hi Rebecca,
How was your line chart so smooth ?
I tried creating a line chart, however, I get a pointed hills.
Please help. Thanks.
- Mark as New
- Bookmark
- Subscribe
- Mute
- Subscribe to RSS Feed
- Permalink
- Report Inappropriate Content

- Mark as New
- Bookmark
- Subscribe
- Mute
- Subscribe to RSS Feed
- Permalink
- Report Inappropriate Content
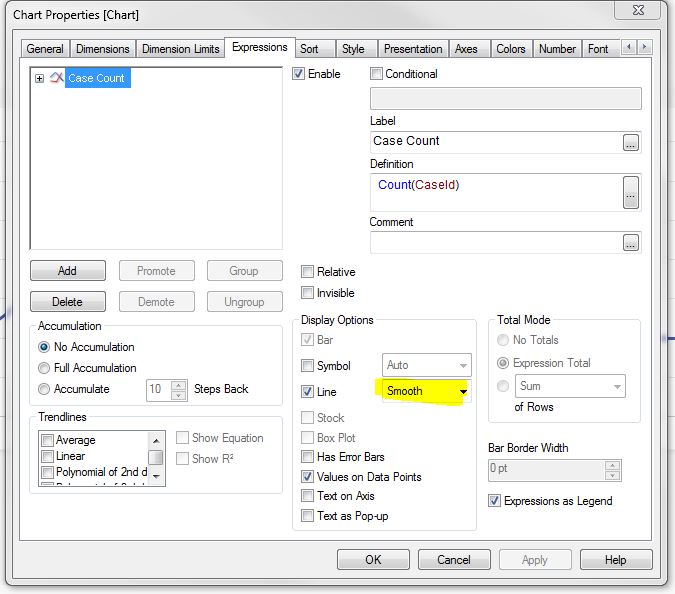
Nishit - You can format the line to be shown as Smooth in Chart Properties:
- Mark as New
- Bookmark
- Subscribe
- Mute
- Subscribe to RSS Feed
- Permalink
- Report Inappropriate Content
Not quite familiar with the chart of qlikview currently, but I think you may read something about the line chart in UI chart component, and that might be unimaginably quite helpful to your question.
- « Previous Replies
-
- 1
- 2
- Next Replies »