Unlock a world of possibilities! Login now and discover the exclusive benefits awaiting you.
- Qlik Community
- :
- All Forums
- :
- QlikView App Dev
- :
- Re: Line chart showing monthly values over several...
- Subscribe to RSS Feed
- Mark Topic as New
- Mark Topic as Read
- Float this Topic for Current User
- Bookmark
- Subscribe
- Mute
- Printer Friendly Page
- Mark as New
- Bookmark
- Subscribe
- Mute
- Subscribe to RSS Feed
- Permalink
- Report Inappropriate Content
Line chart showing monthly values over several years
Hi there,
I have following problem and would appreciate any advice.
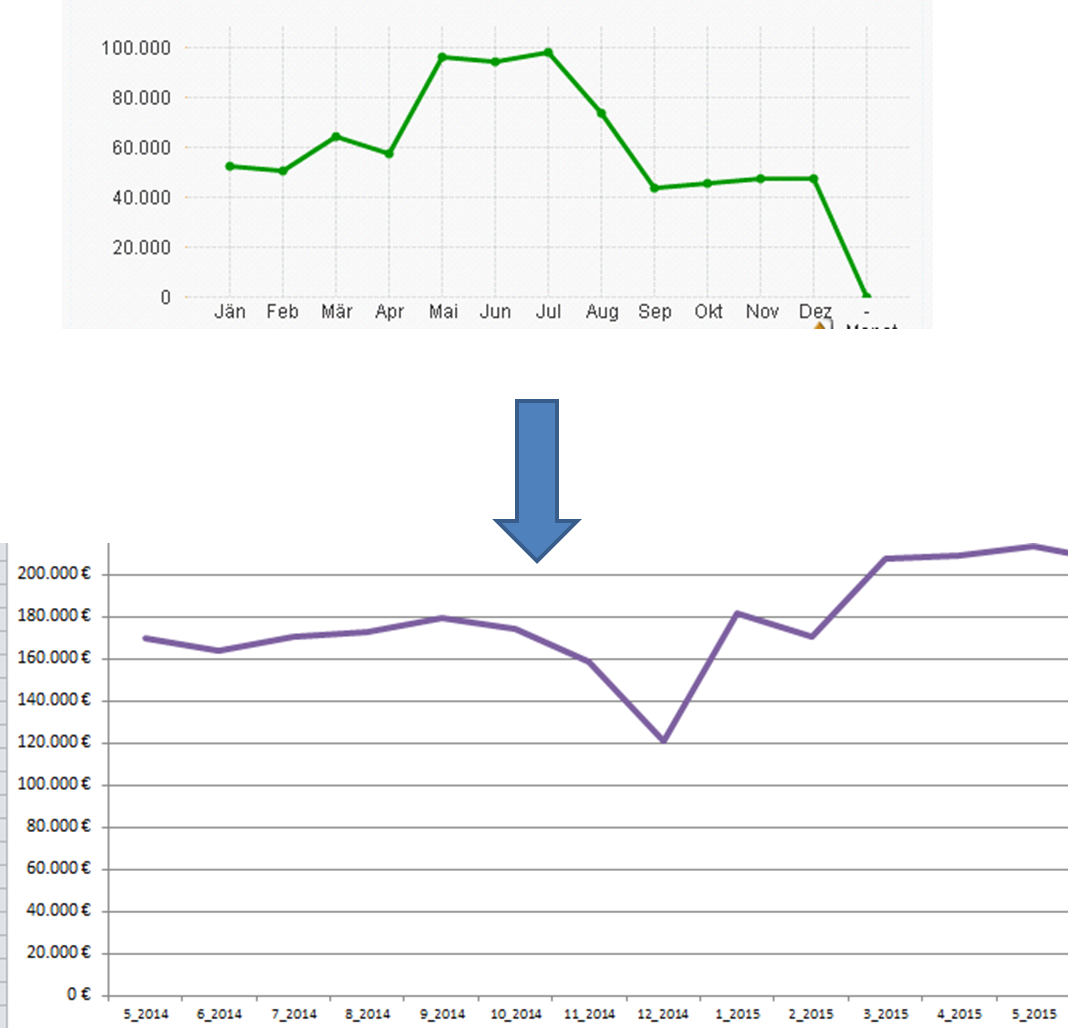
I have a line chart which shows the monthly sum of revenues (expression: sum of revenues, dimension: month).
My problem is, that it shows the average values for all months over several years (screen 1 in the attached image).
What I would like to have, is the monthly sum for all months for every year (screen 2 in the attached image).
Any ideas how I could solve this? Thanks for any help.
- « Previous Replies
-
- 1
- 2
- Next Replies »
- Mark as New
- Bookmark
- Subscribe
- Mute
- Subscribe to RSS Feed
- Permalink
- Report Inappropriate Content
Add Year as your Second dimension and see if that helps.
Misread the requirement::
Try this:
Sum(Aggr(YourExpression, Month))
- Mark as New
- Bookmark
- Subscribe
- Mute
- Subscribe to RSS Feed
- Permalink
- Report Inappropriate Content
Hi,
when I add Year as the second dimension, it adds a second line.
I would rather like to have a continuous value. Do you know how i could achieve that?
- Mark as New
- Bookmark
- Subscribe
- Mute
- Subscribe to RSS Feed
- Permalink
- Report Inappropriate Content
Try this:
Sum(Aggr(YourExpression, Month))
- Mark as New
- Bookmark
- Subscribe
- Mute
- Subscribe to RSS Feed
- Permalink
- Report Inappropriate Content
I tried, but it days: na values available in the chart.
I created two textboxes, the first one with
=sum(order_line_price)
This delivers a result.
The second textbox with
=sum(Aggr(order_line_price,Monat))
This delivers the value 0.
- Mark as New
- Bookmark
- Subscribe
- Mute
- Subscribe to RSS Feed
- Permalink
- Report Inappropriate Content
For second one, try this:
=Sum(Aggr(Sum(order_line_price),Monat))
- Mark as New
- Bookmark
- Subscribe
- Mute
- Subscribe to RSS Feed
- Permalink
- Report Inappropriate Content
Do you have a Month-Year field in your data model?
- Mark as New
- Bookmark
- Subscribe
- Mute
- Subscribe to RSS Feed
- Permalink
- Report Inappropriate Content
Hi, I still have the following dimensions: Monat (=Month), Jahr (=Year)
When I now use the expression
=Sum(Aggr(Sum(order_line_price),Monat))
I get the following:

- Mark as New
- Bookmark
- Subscribe
- Mute
- Subscribe to RSS Feed
- Permalink
- Report Inappropriate Content
No. Would it help to add one? How would I create such one out of a date field of the format DD.MM.YYYY?
- Mark as New
- Bookmark
- Subscribe
- Mute
- Subscribe to RSS Feed
- Permalink
- Report Inappropriate Content
You need to load a Month-Year field into your data model. Try something like:
Date(Floor(YourDate), 'MM-YYYY') as MonthYear
Use this new MonthYear field as your dimension in the chart you are trying to build.
Hope this helps!
- « Previous Replies
-
- 1
- 2
- Next Replies »