Unlock a world of possibilities! Login now and discover the exclusive benefits awaiting you.
- Qlik Community
- :
- All Forums
- :
- QlikView App Dev
- :
- Re: Logic Help !!!
- Subscribe to RSS Feed
- Mark Topic as New
- Mark Topic as Read
- Float this Topic for Current User
- Bookmark
- Subscribe
- Mute
- Printer Friendly Page
- Mark as New
- Bookmark
- Subscribe
- Mute
- Subscribe to RSS Feed
- Permalink
- Report Inappropriate Content
Logic Help !!!
Hi Folks,
I'm calling below dim and exp in a line chart:
Dim :
=if(isnull(GetFieldSelections(Week))=0,
if(Week<=SubField(GetFieldSelections(Week),',',-1),Week),
if(isnull(GetFieldSelections(Month))=0,
Week<=aggr(max(Week),$Field),
if(Week<=53,Week)))
Exp:
rangesum(above((Count(DISTINCT{<Month,Year={'2017'},Week,
Product_Group_N={'CVS'},
Complaint_Classification={'0-km Complaint'},Complaint_Type_Description={'Supplier'}>} NRQNR)),0,RowNo()))

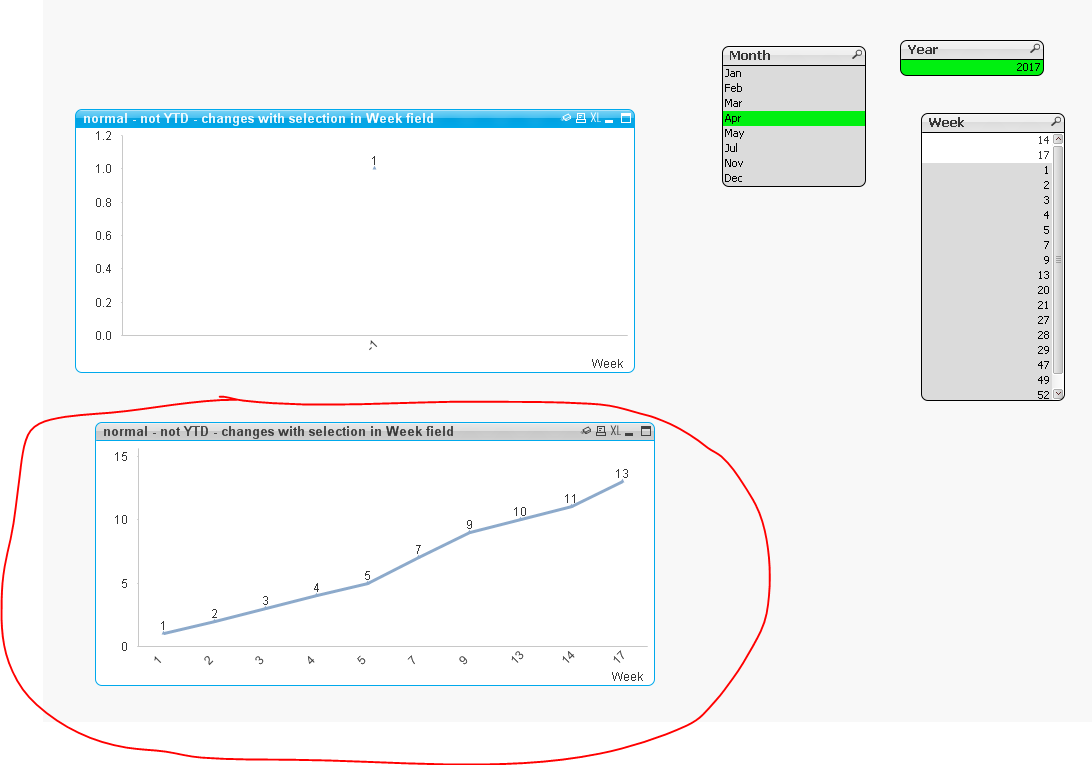
Now when I'm selecting any week lets say in below case 7 , it should show all the prior weeks including 7 , which is working absolutely fine. See below:

The same concept should work for Month also, when I'm selecting Feb , it should show me all weeks data from Jan until selected Feb , but currently it's not working this way.

Any suggestions???
Regards,
AS
- Tags:
- qlikview_scripting
Accepted Solutions
- Mark as New
- Bookmark
- Subscribe
- Mute
- Subscribe to RSS Feed
- Permalink
- Report Inappropriate Content
Why don't you try this
Dimension
Week
Expression
RangeSum(Above((Count(DISTINCT{<Year={'2017'},Month, Week = {"$(='<=' & Max(Week))"}>} CVS)),0,RowNo()))
- Mark as New
- Bookmark
- Subscribe
- Mute
- Subscribe to RSS Feed
- Permalink
- Report Inappropriate Content
May be share sample to test?
- Mark as New
- Bookmark
- Subscribe
- Mute
- Subscribe to RSS Feed
- Permalink
- Report Inappropriate Content
PFA!
Regards,
AS
- Mark as New
- Bookmark
- Subscribe
- Mute
- Subscribe to RSS Feed
- Permalink
- Report Inappropriate Content
Why don't you try this
Dimension
Week
Expression
RangeSum(Above((Count(DISTINCT{<Year={'2017'},Month, Week = {"$(='<=' & Max(Week))"}>} CVS)),0,RowNo()))
- Mark as New
- Bookmark
- Subscribe
- Mute
- Subscribe to RSS Feed
- Permalink
- Report Inappropriate Content
Thank you once again!
Regards,
AS