Unlock a world of possibilities! Login now and discover the exclusive benefits awaiting you.
- Qlik Community
- :
- All Forums
- :
- QlikView App Dev
- :
- Re: Need pie chart help
- Subscribe to RSS Feed
- Mark Topic as New
- Mark Topic as Read
- Float this Topic for Current User
- Bookmark
- Subscribe
- Mute
- Printer Friendly Page
- Mark as New
- Bookmark
- Subscribe
- Mute
- Subscribe to RSS Feed
- Permalink
- Report Inappropriate Content
Need pie chart help
Hi,
I need help for creating Pie chart. There is a column Property Type and based on that I need to do a pie chart of property type percentage that means I want to show each property type percentage in pie chart. So if type1 has 10% or type 2 has 20% of whole property then it will reflect in pie chart.
Thanks,
Sandip
- Mark as New
- Bookmark
- Subscribe
- Mute
- Subscribe to RSS Feed
- Permalink
- Report Inappropriate Content
Hi Sandip,
I make one sample to try to help you.
- Mark as New
- Bookmark
- Subscribe
- Mute
- Subscribe to RSS Feed
- Permalink
- Report Inappropriate Content
Hi,
Can u give me that one? It is not in attachment. Also I am using personal edition. SO kindly give me an screenshot with expression and dimensions
Thanks,
Sandip
- Mark as New
- Bookmark
- Subscribe
- Mute
- Subscribe to RSS Feed
- Permalink
- Report Inappropriate Content
Hi Sandip,
I am sending the image, I hope it helps you

- Mark as New
- Bookmark
- Subscribe
- Mute
- Subscribe to RSS Feed
- Permalink
- Report Inappropriate Content
hi,
I have a table like this:
[Property]:
load * inline [
Property Name
Land
Assembly/Meeting Place
Land
Agricultural
Healthcare
Industrial
Sport & Entertainment
Assembly/Meeting Place
Agricultural
Healthcare
Assembly/Meeting Place
Sport & Entertainment
Land
Assembly/Meeting Place
Multi-Family
Healthcare
Sport & Entertainment
Healthcare
Assembly/Meeting Place
Agricultural
Healthcare
Office
Land
Sport & Entertainment
Retail-Commercial
Assembly/Meeting Place
Land
Lodging and hospitality
Healthcare
Lodging and hospitality
Self-Storage/Mini-storage
Lodging and hospitality
Special Purpose
Single-Family
Special Purpose
Lodging and hospitality
Agricultural
Special Purpose
];
Now I want to show different property type percentage among total property type. So Suppose 'Land' type is 4 times used among 56 times in property type data. So In the pie chart I want show Land [ 4% ] in data values in pie chart.So below is the picture of that:
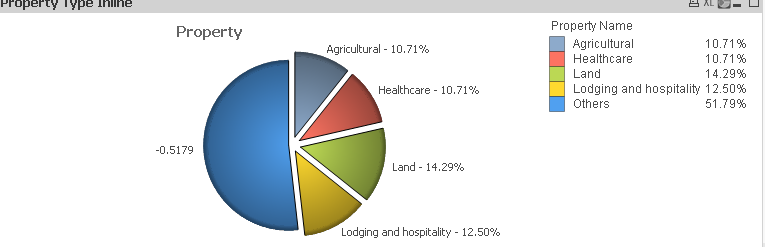
I have used count([Property Name]) in first expression and Values on data points and Text as Popup, unchecked.
and have used =[Property Name] & ' - ' & num(count([Property Name])/Count(total [Property Name]), '##.##%')
as second expression and Values on data points and Text as Popup, checked.
So as a correct value should show for Land property type should show as Land [.25%] - when Land property type is appear 4 times among all property type.
So, please suggest what to do now.
Thanks,
Sandip