Unlock a world of possibilities! Login now and discover the exclusive benefits awaiting you.
- Qlik Community
- :
- All Forums
- :
- QlikView App Dev
- :
- Re: Negative time values export to Excel as ######...
- Subscribe to RSS Feed
- Mark Topic as New
- Mark Topic as Read
- Float this Topic for Current User
- Bookmark
- Subscribe
- Mute
- Printer Friendly Page
- Mark as New
- Bookmark
- Subscribe
- Mute
- Subscribe to RSS Feed
- Permalink
- Report Inappropriate Content
Negative time values export to Excel as ############
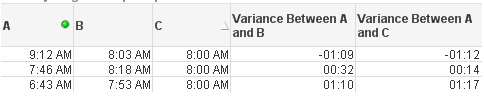
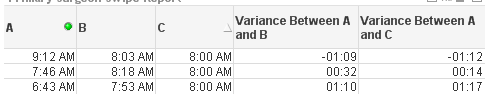
Can someone help with an issue I'm having with negative time values showing up as '#########' when data from a straight table is exported to Excel. As you can see here, the values are correct in QlikView:
But this is what the data looks like once exported to Excel:
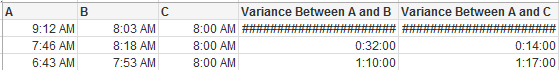
Has anyone else had this issue? If so can you tell me what you did to correct it?
Thanks!
Accepted Solutions
- Mark as New
- Bookmark
- Subscribe
- Mute
- Subscribe to RSS Feed
- Permalink
- Report Inappropriate Content
Hey all,
If anyone is having the same issue, I found a work around. I created this formula for the Variance Between A and B column:
=if(interval(B - A, 'hh:mm') < 0,
'-' & interval(fabs(B - A), 'hh:mm'),
interval(B - A, 'hh:mm')
)
The same formula can be used for the Variance Between A and C column just replace the B with a C.
Here is what the table will look like in QV:
And the data exported out to Excel now looks like this:
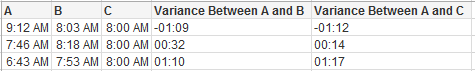
It appears that the Variance columns are now formatted as text, but the data is correct.
I hope this might help someone in the future!
- Mark as New
- Bookmark
- Subscribe
- Mute
- Subscribe to RSS Feed
- Permalink
- Report Inappropriate Content
- Mark as New
- Bookmark
- Subscribe
- Mute
- Subscribe to RSS Feed
- Permalink
- Report Inappropriate Content
For sure it is not a qlik problem, check Excel settings for date time ....
let me know
- Mark as New
- Bookmark
- Subscribe
- Mute
- Subscribe to RSS Feed
- Permalink
- Report Inappropriate Content
jonathan,
thanks for you suggestion. i did look at that post but really didn't see a solution.
- Mark as New
- Bookmark
- Subscribe
- Mute
- Subscribe to RSS Feed
- Permalink
- Report Inappropriate Content
alessandro,
i would rather not have to resort to changing excel settings. it would be ok if i needed to change my settings but to expect hundreds of end users to do the same would not be the best work around. any other ideas?
- Mark as New
- Bookmark
- Subscribe
- Mute
- Subscribe to RSS Feed
- Permalink
- Report Inappropriate Content
Hey all,
If anyone is having the same issue, I found a work around. I created this formula for the Variance Between A and B column:
=if(interval(B - A, 'hh:mm') < 0,
'-' & interval(fabs(B - A), 'hh:mm'),
interval(B - A, 'hh:mm')
)
The same formula can be used for the Variance Between A and C column just replace the B with a C.
Here is what the table will look like in QV:
And the data exported out to Excel now looks like this:
It appears that the Variance columns are now formatted as text, but the data is correct.
I hope this might help someone in the future!