Unlock a world of possibilities! Login now and discover the exclusive benefits awaiting you.
- Qlik Community
- :
- All Forums
- :
- QlikView App Dev
- :
- Re: Net Change
- Subscribe to RSS Feed
- Mark Topic as New
- Mark Topic as Read
- Float this Topic for Current User
- Bookmark
- Subscribe
- Mute
- Printer Friendly Page
- Mark as New
- Bookmark
- Subscribe
- Mute
- Subscribe to RSS Feed
- Permalink
- Report Inappropriate Content
Net Change
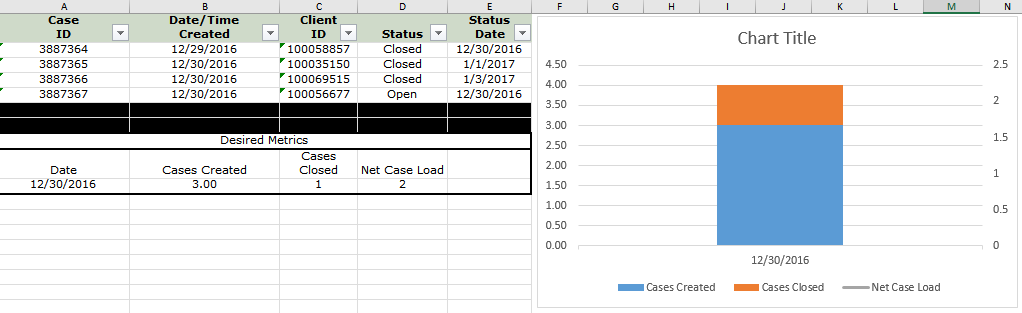
I have an Excel sheet that shows a ticket's Created Date and a Status Date. I'd like to know the total count of tickets on a given day MINUS the count of tickets Closed that day to get a net change in ticket count.
Example:
January 1st 2017 : 500 tickets with created date equal to 1/1/2017
200 tickets with status=Closed AND Status Date = 1/1/2017
= 300 Net tickets for 1/1/2017
How do I graph this with the proper expressions?
- Mark as New
- Bookmark
- Subscribe
- Mute
- Subscribe to RSS Feed
- Permalink
- Report Inappropriate Content
Can you post some sample data?
- Mark as New
- Bookmark
- Subscribe
- Mute
- Subscribe to RSS Feed
- Permalink
- Report Inappropriate Content
- Mark as New
- Bookmark
- Subscribe
- Mute
- Subscribe to RSS Feed
- Permalink
- Report Inappropriate Content
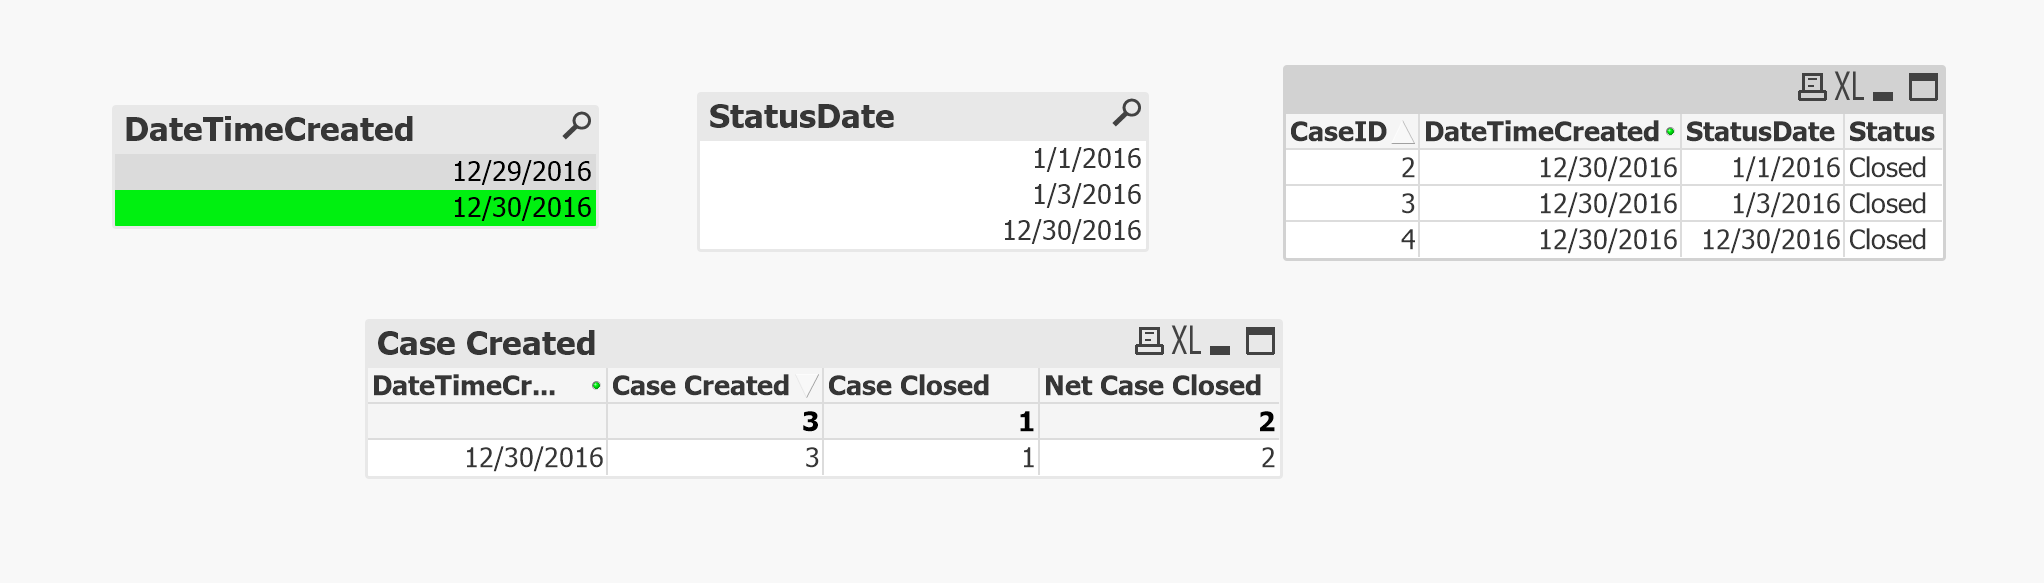
A Combo Chart cannot have more than 1 measure (Case count) when 2 dimensions (Date and Status) are included. In such cases a second measure (Net Change) for line chart cannot be added. But if you treat all the 3 as measures (Cases Created, Cases Closed and Net Change) then 2 measures can be stacked and the other one can be displayed as Line in the Combo Chart. Attached is the solution for your reference.
Have a nice day!
- Mark as New
- Bookmark
- Subscribe
- Mute
- Subscribe to RSS Feed
- Permalink
- Report Inappropriate Content
May be something like this, not sure though
- Mark as New
- Bookmark
- Subscribe
- Mute
- Subscribe to RSS Feed
- Permalink
- Report Inappropriate Content
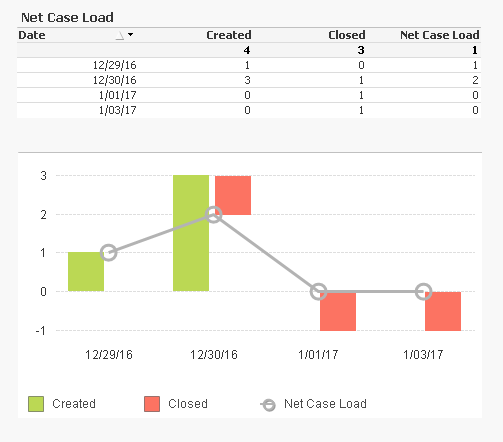
I'd like to suggest a different approach where New tickets add up and Close subtract. I hope this helps...
- Mark as New
- Bookmark
- Subscribe
- Mute
- Subscribe to RSS Feed
- Permalink
- Report Inappropriate Content