Unlock a world of possibilities! Login now and discover the exclusive benefits awaiting you.
- Qlik Community
- :
- All Forums
- :
- QlikView App Dev
- :
- Re: One-Bar Stacked Bar Chart
- Subscribe to RSS Feed
- Mark Topic as New
- Mark Topic as Read
- Float this Topic for Current User
- Bookmark
- Subscribe
- Mute
- Printer Friendly Page
- Mark as New
- Bookmark
- Subscribe
- Mute
- Subscribe to RSS Feed
- Permalink
- Report Inappropriate Content
One-Bar Stacked Bar Chart
Hi all,
as the search didnt get me a suitable answer I ask you guys to help me. 
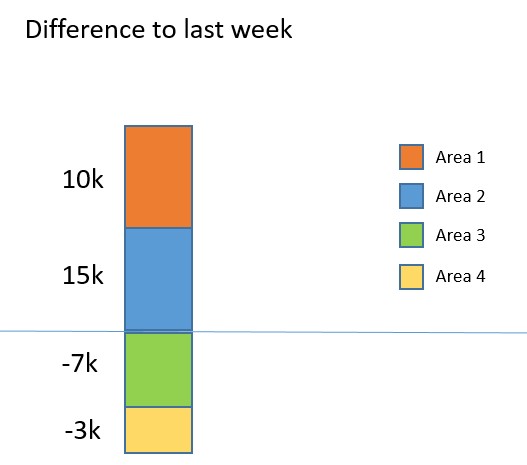
I try to make a Stacked Bar chart with only one bar divided by areas and it should display the difference to last week.
So the bar in total is the complete difference to last weeks value and that divided by areas in the stacked bar.
I tried several things and variations of expressions like restrict the dimension to the largest week and sum()-below(sum) and so on.
Nothing worked out yet.
Do you guys have an idea?
Best regards,
Seb
- Mark as New
- Bookmark
- Subscribe
- Mute
- Subscribe to RSS Feed
- Permalink
- Report Inappropriate Content
Not sure I´m following you.
Maybe if you post a sample of your data and a prototype (Paint, Excel, whatever) we could figure out a way to help you
- Mark as New
- Bookmark
- Subscribe
- Mute
- Subscribe to RSS Feed
- Permalink
- Report Inappropriate Content
This is a super simplified mockup I try to give you a sample but this will take some minutes.
- Mark as New
- Bookmark
- Subscribe
- Mute
- Subscribe to RSS Feed
- Permalink
- Report Inappropriate Content
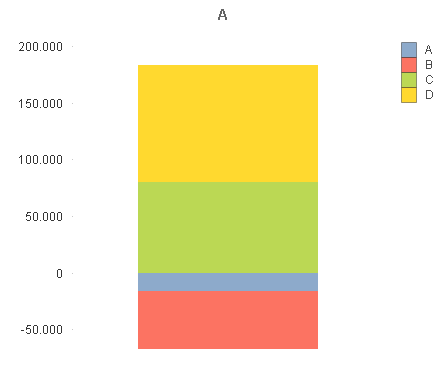
4 expressions and 0 dimension solves your need?
- Mark as New
- Bookmark
- Subscribe
- Mute
- Subscribe to RSS Feed
- Permalink
- Report Inappropriate Content
Attaching my sample
- Mark as New
- Bookmark
- Subscribe
- Mute
- Subscribe to RSS Feed
- Permalink
- Report Inappropriate Content
Here is a super super simplified sample. The original data is much more detailed with more subareas and so on
- Mark as New
- Bookmark
- Subscribe
- Mute
- Subscribe to RSS Feed
- Permalink
- Report Inappropriate Content
Unfortunately it doesnt solves my need. 
If I would do it with only expressions I cant filter by Area or whatever.
It must be dynamic.