Unlock a world of possibilities! Login now and discover the exclusive benefits awaiting you.
- Qlik Community
- :
- All Forums
- :
- QlikView App Dev
- :
- Re: Pivot chart dimension union of fields
- Subscribe to RSS Feed
- Mark Topic as New
- Mark Topic as Read
- Float this Topic for Current User
- Bookmark
- Subscribe
- Mute
- Printer Friendly Page
- Mark as New
- Bookmark
- Subscribe
- Mute
- Subscribe to RSS Feed
- Permalink
- Report Inappropriate Content
Pivot chart dimension union of fields
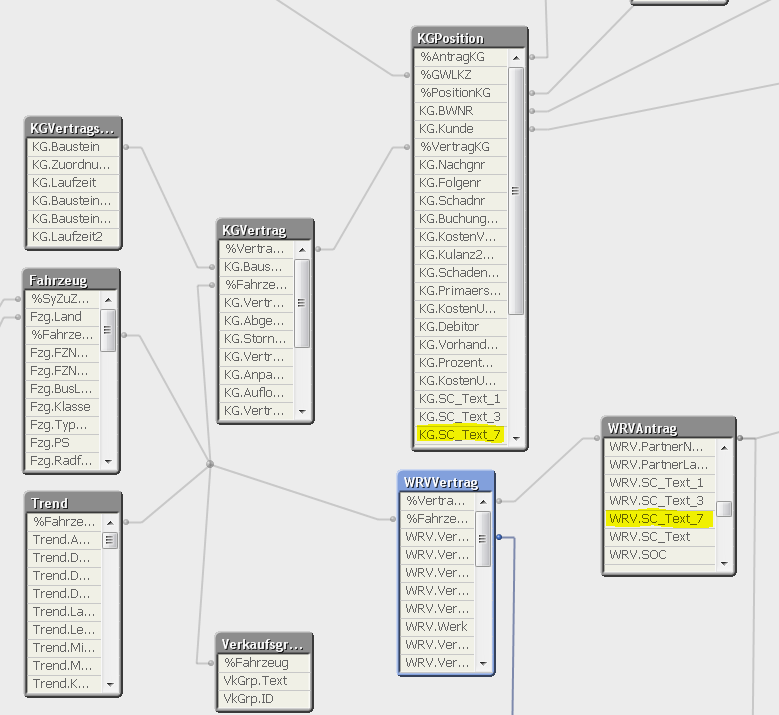
We try to add one (and only one) dimension to a pivot chart that shall show data from two fields
named KG.SC_text7 and WRV.SC_Text7. The fields are in different tables.
The outcome shall be that the content of the dimension is the union of the content of the fields.
One idea to do this was to add a link table with all values of the fields.
This resulted in a circular reference because of the already existing star scheme.
So this does not work.
Now the question is if it is possible to unite the fields in this pivot chart dimension
by some special expression (set analysis?) or is there any other way to get it done.
Do we have to rework the data model?
The version used is QV 11.2 SR 8.
Thanks a lot.
Accepted Solutions
- Mark as New
- Bookmark
- Subscribe
- Mute
- Subscribe to RSS Feed
- Permalink
- Report Inappropriate Content
The answer to this question is that you have to rework the data model and bring these fields together into one table as one field.
It is for sure possible to build a link table referencing to %Fahrzeug including the values of KG.SC_Text7 and WRV.SC_Text7. You will have a proper selection in the pivot chart.
Finally it turns out that the selection will not work properly when you aggregate data from two different branches of the star scheme. This is because the selection does not exclude enough values. The result is that there are wrong sums.
- Mark as New
- Bookmark
- Subscribe
- Mute
- Subscribe to RSS Feed
- Permalink
- Report Inappropriate Content
Could you share a screenshot of your data model to us?
- Mark as New
- Bookmark
- Subscribe
- Mute
- Subscribe to RSS Feed
- Permalink
- Report Inappropriate Content
Thanks for looking at it.
- Mark as New
- Bookmark
- Subscribe
- Mute
- Subscribe to RSS Feed
- Permalink
- Report Inappropriate Content
The answer to this question is that you have to rework the data model and bring these fields together into one table as one field.
It is for sure possible to build a link table referencing to %Fahrzeug including the values of KG.SC_Text7 and WRV.SC_Text7. You will have a proper selection in the pivot chart.
Finally it turns out that the selection will not work properly when you aggregate data from two different branches of the star scheme. This is because the selection does not exclude enough values. The result is that there are wrong sums.