Unlock a world of possibilities! Login now and discover the exclusive benefits awaiting you.
- Qlik Community
- :
- All Forums
- :
- QlikView App Dev
- :
- Re: Pivot table
- Subscribe to RSS Feed
- Mark Topic as New
- Mark Topic as Read
- Float this Topic for Current User
- Bookmark
- Subscribe
- Mute
- Printer Friendly Page
- Mark as New
- Bookmark
- Subscribe
- Mute
- Subscribe to RSS Feed
- Permalink
- Report Inappropriate Content
Pivot table
Hi community,
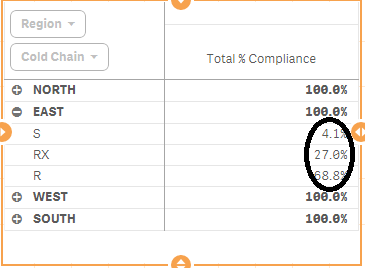
In Pivot table i have regions & Branch_type in which i want to show 100% per each branch_type and region
Actually when i used bar chart for region and keep expression like this
Count({$<param_name={'Temperature'},param_value={'<=-1'}>}param_value)/
Count(total <region_name>{<param_name={'Temperature'},param_value={'<=-1'}>}param_value)
it shows 100% for each region.
when i used bar chart for branch_chart and keep expression like this
Count({$<param_name={'Temperature'},param_value={'<=-1'}>}param_value)/
Count(total <branch_type>{<param_name={'Temperature'},param_value={'<=-1'}>}param_value)
it shows 100% for each branch_type.
i want to collaborate results in bar charts into pivot but it won't come.
what changes in expression need to put in pivot table (Total % Compliance)?
so that i can also show branch_type 100%.
- Tags:
- new_to_qlikview
- Mark as New
- Bookmark
- Subscribe
- Mute
- Subscribe to RSS Feed
- Permalink
- Report Inappropriate Content
Provide sample data please !
Also, your description is little confusion.
Provide some more information with little more description about logic and your requirement.
or Try
TOTAL <branch_type, region_name>
- Mark as New
- Bookmark
- Subscribe
- Mute
- Subscribe to RSS Feed
- Permalink
- Report Inappropriate Content
Hi Manish,.
TOTAL <branch_type, region_name>---it is not working.
actually i'm showing ranges of param_value
like
-1 to -10
-10.1 to -13.9
-14 to -17.9
-18 below
in stack bar chart. for this purpose two bar charts are 100%.
and this result i have to collaborate in Pivot.
but before showing % for stack i.e ranges of param_value in pivot. i'm trying to show 100% for region & branch_type both.
if i get formula i can change param_value at numerator to '-18' or '<=-1>=-10' so that i can get % compliance for my ranges.
- Mark as New
- Bookmark
- Subscribe
- Mute
- Subscribe to RSS Feed
- Permalink
- Report Inappropriate Content
its better if you post your QVW file