Unlock a world of possibilities! Login now and discover the exclusive benefits awaiting you.
- Qlik Community
- :
- All Forums
- :
- QlikView App Dev
- :
- Re: Qlikview: Line Chart With Daily Values and Mon...
- Subscribe to RSS Feed
- Mark Topic as New
- Mark Topic as Read
- Float this Topic for Current User
- Bookmark
- Subscribe
- Mute
- Printer Friendly Page
- Mark as New
- Bookmark
- Subscribe
- Mute
- Subscribe to RSS Feed
- Permalink
- Report Inappropriate Content
Qlikview: Line Chart With Daily Values and Month as my visible dimension
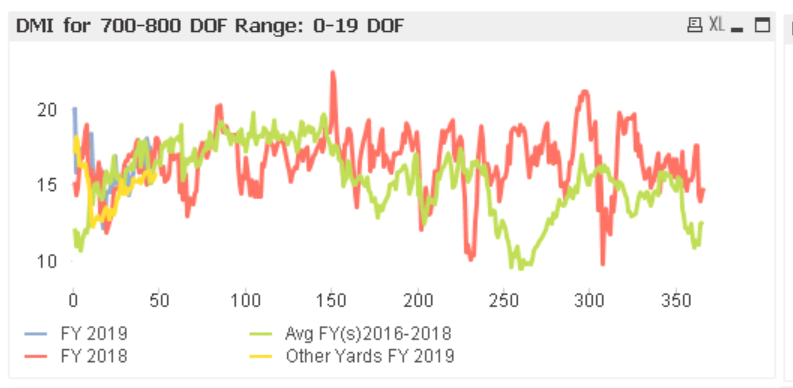
I am trying to create a line chart that shows values for each day of the year, but I would like my axes to show the name description of the month. I currently have the day within the year 1-365 assigned to each calendar day and the corresponding month within my calendar table. Below you can see what I have gotten so far, but I would like to not show the 0-365 days as my dimension/label and instead on Day 1 show Jan, 32 show Feb and so on.
Another example would be I have hourly data for energy that I would like to show to see the spikes within a day, but the label would be day as I'm showing a week/month's worth of data points in the chart.
I'm not allowed to publish calculated dimensions at this time, though if it is my only option I will present and try for approval.
I'm currently working in QlikView 12 and thanks in advance for any help.
- Mark as New
- Bookmark
- Subscribe
- Mute
- Subscribe to RSS Feed
- Permalink
- Report Inappropriate Content
Tough to explain, will you provide sample. One reason could continuous option may solve the problem
- Mark as New
- Bookmark
- Subscribe
- Mute
- Subscribe to RSS Feed
- Permalink
- Report Inappropriate Content
I'm really sorry for the delay, I'm having trouble figuring out how to attach a file. I have an excel file with sample data and chart I can upload.

- Mark as New
- Bookmark
- Subscribe
- Mute
- Subscribe to RSS Feed
- Permalink
- Report Inappropriate Content
Hi Brandi,
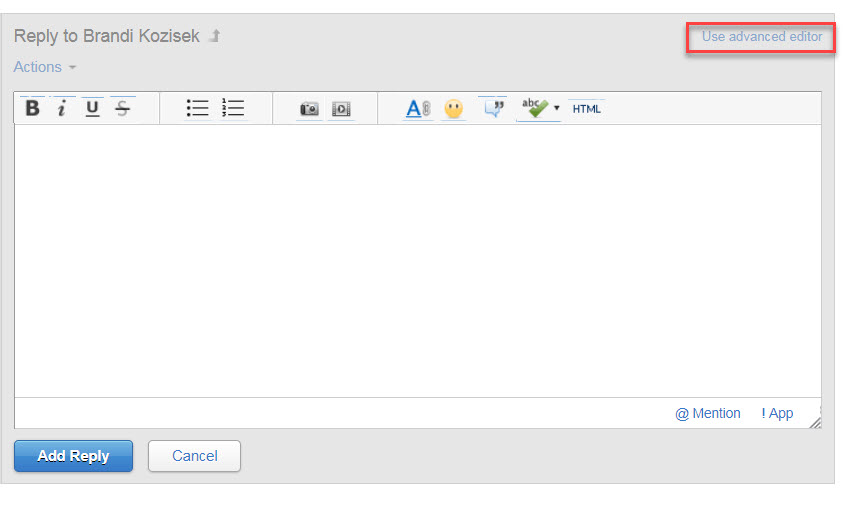
You can attach files to Replies by clicking on "Use Advanced Editor" in the upper right corner.
Then, choose "Attach" from the lower right corner.

I hope this helps!
Best,
Qlik Community Team
- Mark as New
- Bookmark
- Subscribe
- Mute
- Subscribe to RSS Feed
- Permalink
- Report Inappropriate Content
Just to clarify, you'll need to visit the actual thread in the community, rather than replying from your Inbox & Activity area of your profile. When viewing your Inbox, just click on the thread title to go to the actual thread:

- Mark as New
- Bookmark
- Subscribe
- Mute
- Subscribe to RSS Feed
- Permalink
- Report Inappropriate Content
When I click reply I don't have the option of use advanced editor showing up in the right hand corner as your screen shot shows. Is there a browser or version that I need to make sure I'm on?
- Mark as New
- Bookmark
- Subscribe
- Mute
- Subscribe to RSS Feed
- Permalink
- Report Inappropriate Content
Sorry for the delay, please find attached an excel file with some sample data and an example chart. I don't need the months to repeat as they are in the attached file, but if that is the best we can get we will deal with it.
Thanks again for the assistance.
- Mark as New
- Bookmark
- Subscribe
- Mute
- Subscribe to RSS Feed
- Permalink
- Report Inappropriate Content
Thank you, sorry for the confusion on my part.
- Mark as New
- Bookmark
- Subscribe
- Mute
- Subscribe to RSS Feed
- Permalink
- Report Inappropriate Content
Hi Brandi,
Are you viewing the thread itself, or from the Inbox area? Here's a direct link to the thread: Qlikview: Line Chart With Daily Values and Month as my visible dimension