Unlock a world of possibilities! Login now and discover the exclusive benefits awaiting you.
- Qlik Community
- :
- All Forums
- :
- QlikView App Dev
- :
- Re: Selection of ListBox changing ranking table
- Subscribe to RSS Feed
- Mark Topic as New
- Mark Topic as Read
- Float this Topic for Current User
- Bookmark
- Subscribe
- Mute
- Printer Friendly Page
- Mark as New
- Bookmark
- Subscribe
- Mute
- Subscribe to RSS Feed
- Permalink
- Report Inappropriate Content
Selection of ListBox changing ranking table
Hi,
my QV project contains measurement power values of different machines and their time (1 value every 100milliseconds). I want to calculate the maximum 15min average values of every machine and rank them in a table.
The tricky part is, that the user should select from a seperate ListBox, if the displayed values are 15min average or 10min average or 5min average values from a ListBox. This ListBox should only change the ranking table and no other diagramms/tables.
I attached a QV project.
Explanation: "Prozess" = machine, "Zustand", "Variante" are sub categories of the machine; "Zeit" = time, "Leistung" = power value
I hope you can help me.
With kind regards,
Alex
- Tags:
- new_to_qlikview
- Mark as New
- Bookmark
- Subscribe
- Mute
- Subscribe to RSS Feed
- Permalink
- Report Inappropriate Content
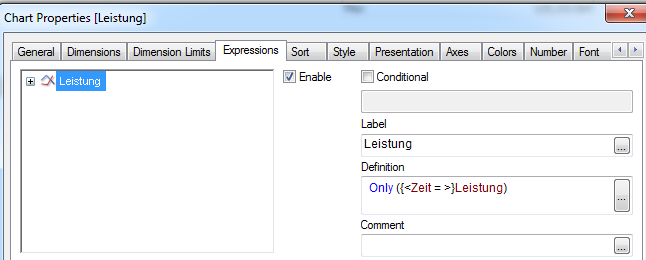
So are refering to this chart not changing when you make a selection to Zeit?

Use this in your expression for objects that should not change with selection to Zeit {<Zeit = >}
Hope this is what you were looking to do, I apologize if I did not understand your requirement.
Best,
S
- Mark as New
- Bookmark
- Subscribe
- Mute
- Subscribe to RSS Feed
- Permalink
- Report Inappropriate Content
Hi sunindia,
thank you for your answer.
Unfortunately this is not what I am looking for.
I want to create another table diagramm (similar to the table diagramm in the top right corner "Top-Verbraucher") but in the new table diagramm the function =Rank(Sum(Leistung)) needs to be changed.
The new function should calculate the average value of "Leistung" for a certain period of time ("Zeit"). The goal is to let the user choose (e.g. through a ListBox) how long the period of time should be.
I attached a picture which should illustrate the concept.
Greetings,
Alex
- Mark as New
- Bookmark
- Subscribe
- Mute
- Subscribe to RSS Feed
- Permalink
- Report Inappropriate Content
I try a different approach:
My data looks like this:
| Machine | State | Variant | Time [in seconds] | Power Value |
|---|---|---|---|---|
| A | working | Var1 | 0,1 | 990 |
| A | working | Var1 | 0,2 | 1000 |
| A | working | Var1 | 0,3 | 1100 |
| B | setting up | Var2 | 20 | |
| ... | ... | ... | ... | ... |
I want a table diagram that looks like this:
| Rank | Machine | Aggregated Power Value |
|---|---|---|
| 1 | Machine A | 5065 |
| 2 | Machine C | 4788 |
| 3 | Machine X | 3578 |
| ... | ... | ... |
The "Aggregated Power Value" is the maximum of the average power value for a certain period of time. So lets say, i want the maximum average for 15min for Machine A, which is: (990 + 1000 + 1100 +...)/(15*60*10). So i sum up the 9000 power values between the seconds 0,1 and 900,0 and divde them through 9000. The next average value is between the seconds 900,1 and 1800,0.
After that i got lots of 15min average values for every machine. Now i want to select the maximum value per machine and rank them.
There should be also a ListBox or sth similar, where the user can select, how long the time period of the calculation above should be.
It should look like this:
| Please select the time intervall |
|---|
| 30min |
| 15 min |
| 10min |
| 5min |
| 1min |
How do I achieve now, that the user can select the time intervall in the listbox and the ranking table changes accordingly?
Greetings,