Unlock a world of possibilities! Login now and discover the exclusive benefits awaiting you.
- Qlik Community
- :
- All Forums
- :
- QlikView App Dev
- :
- Re: Set Analysis - Graph
- Subscribe to RSS Feed
- Mark Topic as New
- Mark Topic as Read
- Float this Topic for Current User
- Bookmark
- Subscribe
- Mute
- Printer Friendly Page
- Mark as New
- Bookmark
- Subscribe
- Mute
- Subscribe to RSS Feed
- Permalink
- Report Inappropriate Content
Set Analysis - Graph
Hi all,
I've got a challenge that I'm not able to tackle. Below graph shows the volume progress over the month compared with last month and a lineair projection. The challenge is that the the 'Day' axis always shows 31 instead of the number of days in the currenth month.
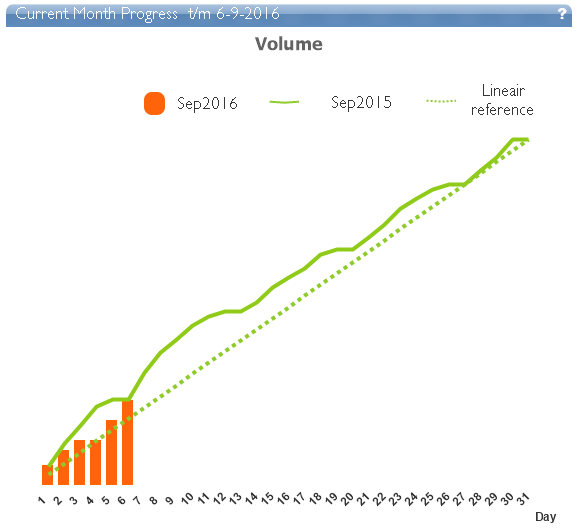
When I select 'Sep' in the dimension Month the graph obviously will show 30 days. So I tried below set analysis with
=Sum({<CurMTDFlag={1},Month={"=Month(maxDate)"}, Local_Flag={1}>} $(VarFact)), but that doesn't do the trick.
Should I use the Day dimension or is my set analysis incomplete/wrong?
Thanks
- « Previous Replies
-
- 1
- 2
- Next Replies »
- Mark as New
- Bookmark
- Subscribe
- Mute
- Subscribe to RSS Feed
- Permalink
- Report Inappropriate Content
you Should need to use Date->'DD'as dimension
- Mark as New
- Bookmark
- Subscribe
- Mute
- Subscribe to RSS Feed
- Permalink
- Report Inappropriate Content
Are you trying to get rid of the extra days which doesn't have a bar?
- Mark as New
- Bookmark
- Subscribe
- Mute
- Subscribe to RSS Feed
- Permalink
- Report Inappropriate Content
September has 30 days and I'm trying to get rid of day 31
- Mark as New
- Bookmark
- Subscribe
- Mute
- Subscribe to RSS Feed
- Permalink
- Report Inappropriate Content
May be try using Day(Date) as your dimension and see what happens
- Mark as New
- Bookmark
- Subscribe
- Mute
- Subscribe to RSS Feed
- Permalink
- Report Inappropriate Content
Day(MonthEnd(YourDateField))
- Mark as New
- Bookmark
- Subscribe
- Mute
- Subscribe to RSS Feed
- Permalink
- Report Inappropriate Content
This is the end result I'm looking for. (Don't mind the table and meter...)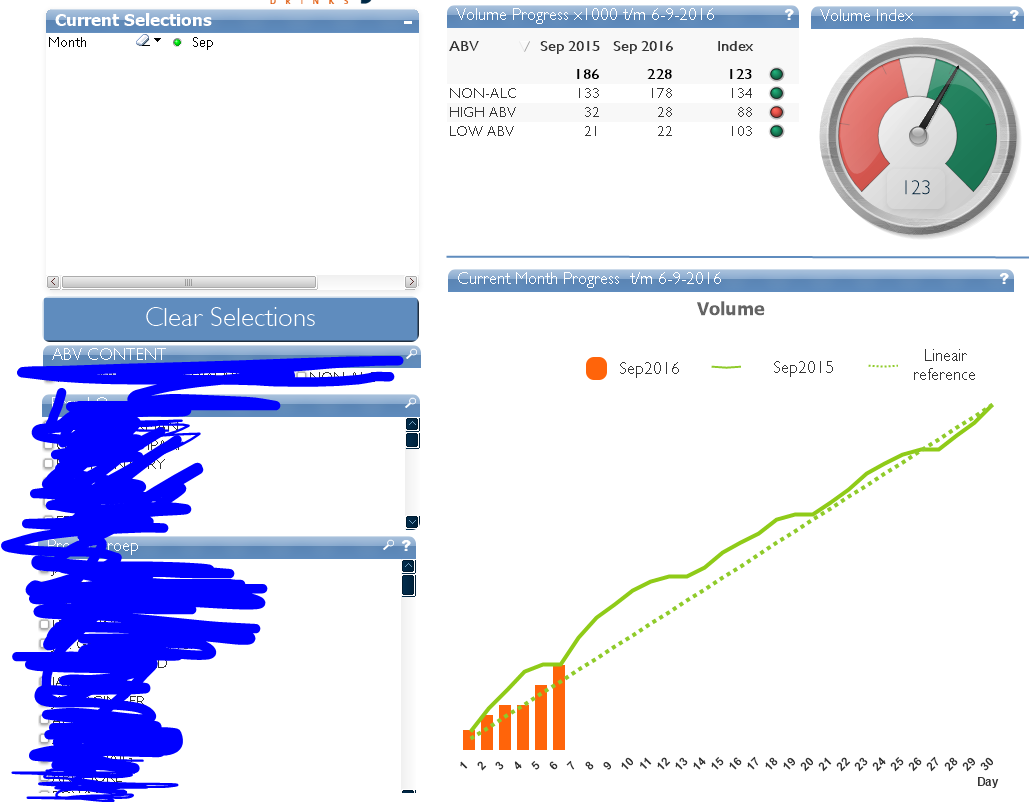
- Mark as New
- Bookmark
- Subscribe
- Mute
- Subscribe to RSS Feed
- Permalink
- Report Inappropriate Content
Did you try using Day(Date) as your dimension?
- Mark as New
- Bookmark
- Subscribe
- Mute
- Subscribe to RSS Feed
- Permalink
- Report Inappropriate Content
Yes, Day(Date) is the used dimension
- Mark as New
- Bookmark
- Subscribe
- Mute
- Subscribe to RSS Feed
- Permalink
- Report Inappropriate Content
Can you check your calendar to check if September somehow have 31 days in the script
- « Previous Replies
-
- 1
- 2
- Next Replies »