Unlock a world of possibilities! Login now and discover the exclusive benefits awaiting you.
- Qlik Community
- :
- All Forums
- :
- QlikView App Dev
- :
- Show territories sales sum with zero Sales
- Subscribe to RSS Feed
- Mark Topic as New
- Mark Topic as Read
- Float this Topic for Current User
- Bookmark
- Subscribe
- Mute
- Printer Friendly Page
- Mark as New
- Bookmark
- Subscribe
- Mute
- Subscribe to RSS Feed
- Permalink
- Report Inappropriate Content
Show territories sales sum with zero Sales
Hello Everyone,
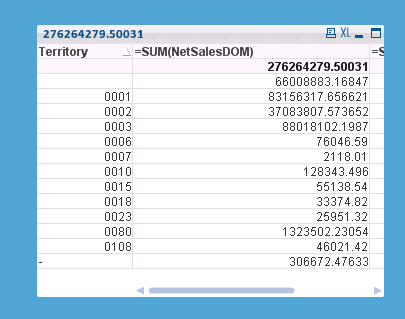
So I have a chart that I am using to show the NetSales by Territory but doesn't show territories with no sales in a given set.
When I do a simple sum, I get this.
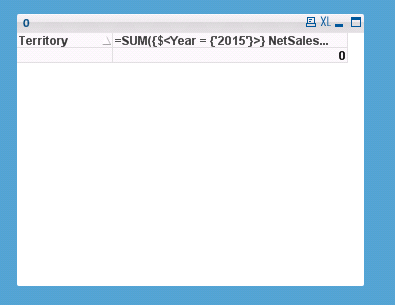
However, they want Month to date, meaning I need to use Set Analysis and restrict to the current year (=SUM({$<Year = {'$(vYear_Current)'}>} NetSalesDOM)) I get an empty chart because there aren't any sales for the current year of 2015. How do I make the set return a zero in the place of a null set sum?
Any help in this matter is greatly appreciated
Accepted Solutions
- Mark as New
- Bookmark
- Subscribe
- Mute
- Subscribe to RSS Feed
- Permalink
- Report Inappropriate Content
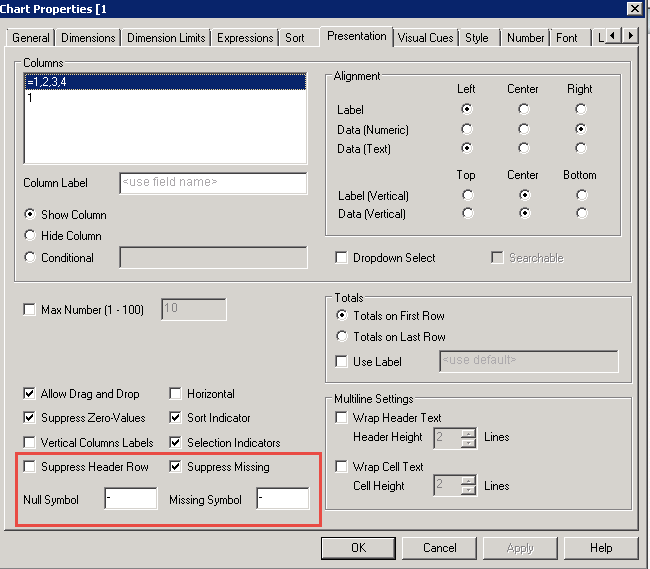
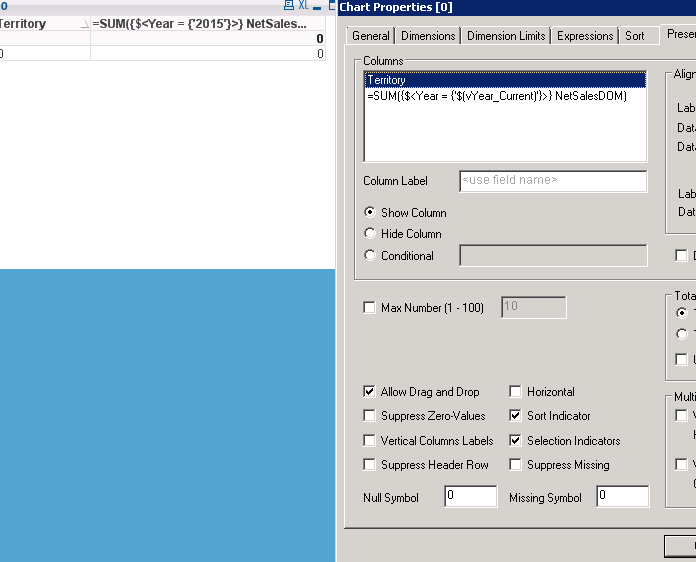
If I understand correctly, maybe you should try "Show all values" in the dimension options, and in the "Presentation" tab, change the Null and Missing Simbol to 0
- Mark as New
- Bookmark
- Subscribe
- Mute
- Subscribe to RSS Feed
- Permalink
- Report Inappropriate Content
If I understand correctly, maybe you should try "Show all values" in the dimension options, and in the "Presentation" tab, change the Null and Missing Simbol to 0
- Mark as New
- Bookmark
- Subscribe
- Mute
- Subscribe to RSS Feed
- Permalink
- Report Inappropriate Content
Uncheck "Suppress Zero Values" on the Presentation pane.
-Rob
- Mark as New
- Bookmark
- Subscribe
- Mute
- Subscribe to RSS Feed
- Permalink
- Report Inappropriate Content
Thanks German, but no dice. It still doesn't show me the Territories. Also, setting the "Show All Values" to true doesn't work either 
- Mark as New
- Bookmark
- Subscribe
- Mute
- Subscribe to RSS Feed
- Permalink
- Report Inappropriate Content
Never mind, apparently I was clicking "OK" and not "APPLY" after de-selecting the "Suppress Zero-Values". German was right.