Unlock a world of possibilities! Login now and discover the exclusive benefits awaiting you.
Announcements
April 13–15 - Dare to Unleash a New Professional You at Qlik Connect 2026: Register Now!
- Qlik Community
- :
- All Forums
- :
- QlikView App Dev
- :
- Simple Table to Line Chart
Options
- Subscribe to RSS Feed
- Mark Topic as New
- Mark Topic as Read
- Float this Topic for Current User
- Bookmark
- Subscribe
- Mute
- Printer Friendly Page
Turn on suggestions
Auto-suggest helps you quickly narrow down your search results by suggesting possible matches as you type.
Showing results for
Not applicable
2011-10-14
05:55 PM
- Mark as New
- Bookmark
- Subscribe
- Mute
- Subscribe to RSS Feed
- Permalink
- Report Inappropriate Content
Simple Table to Line Chart
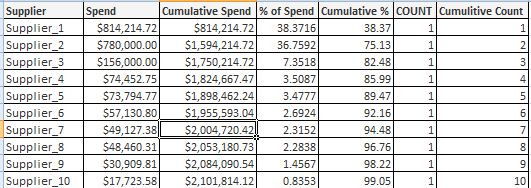
I've created the following chart. All columns are expressions except Supplier.
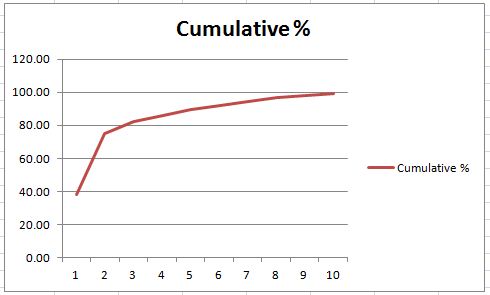
And now I want to create this type of line chart (or something similar):
877 Views
1 Reply
MVP
2011-10-14
06:11 PM
- Mark as New
- Bookmark
- Subscribe
- Mute
- Subscribe to RSS Feed
- Permalink
- Report Inappropriate Content
Hi jenvontaylor,
it seems that you already have everything at hand.
You could copy your table chart object, then go to properties, general tab and select the line chart.
Go to expression tab and disable all expressions except Cumulative %.
So you should have dimension Supplier and expression Cumulative%.
You could modify the min / max values of y-axis and x-axis labelling on axis tab.
Hope this helps,
Stefan
318 Views