Unlock a world of possibilities! Login now and discover the exclusive benefits awaiting you.
- Qlik Community
- :
- All Forums
- :
- QlikView App Dev
- :
- Stacked Line Chart
- Subscribe to RSS Feed
- Mark Topic as New
- Mark Topic as Read
- Float this Topic for Current User
- Bookmark
- Subscribe
- Mute
- Printer Friendly Page
- Mark as New
- Bookmark
- Subscribe
- Mute
- Subscribe to RSS Feed
- Permalink
- Report Inappropriate Content
Stacked Line Chart
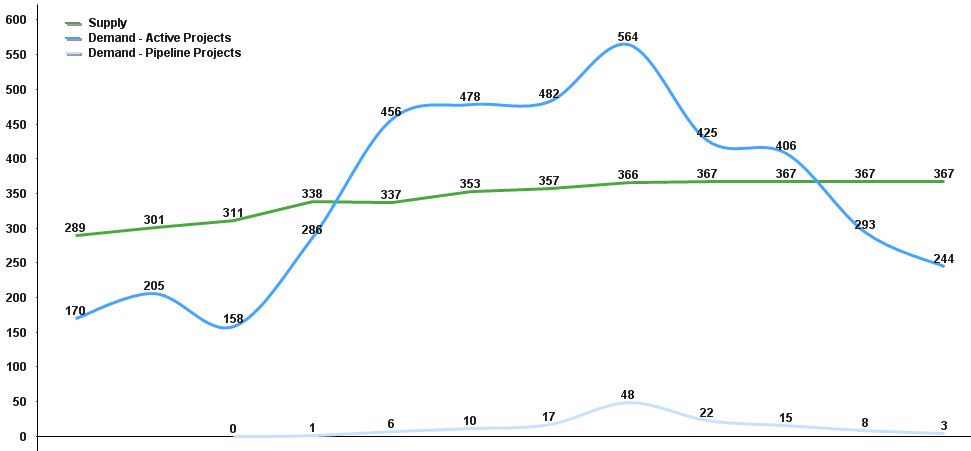
Hi..Can anybody please help how to plot a stacked area chart by converting the existing line graphs.
I need to plot a demand and supply stacked area chart..Currently i have 3 line charts as attached. I need to have these as stacked area charts. Can anybody please share the steps how to do this in QV?
Thanks
Sanjyot
- « Previous Replies
-
- 1
- 2
- Next Replies »
- Mark as New
- Bookmark
- Subscribe
- Mute
- Subscribe to RSS Feed
- Permalink
- Report Inappropriate Content
Hi Sanjoy,
Have look under "Style" and pick the number two from the left bottom. Originally this stacks them on top of each other, but if you take Expr1-Expr2 then with that logic it should help.
See attached.
- Mark as New
- Bookmark
- Subscribe
- Mute
- Subscribe to RSS Feed
- Permalink
- Report Inappropriate Content
Goto the Style tab of the chart -> Choose one style from the Look option(last two).
- Mark as New
- Bookmark
- Subscribe
- Mute
- Subscribe to RSS Feed
- Permalink
- Report Inappropriate Content
In the expression tab of chart properties you can use the >Display Option> next to Line > you can chose the smooth and value on the data points . This will get a chart according to your requirement
- Mark as New
- Bookmark
- Subscribe
- Mute
- Subscribe to RSS Feed
- Permalink
- Report Inappropriate Content
!Thanks..I am getting 2 X axis when I change the style but I need only one X axis to show that the demand and supply start from the same x axis. 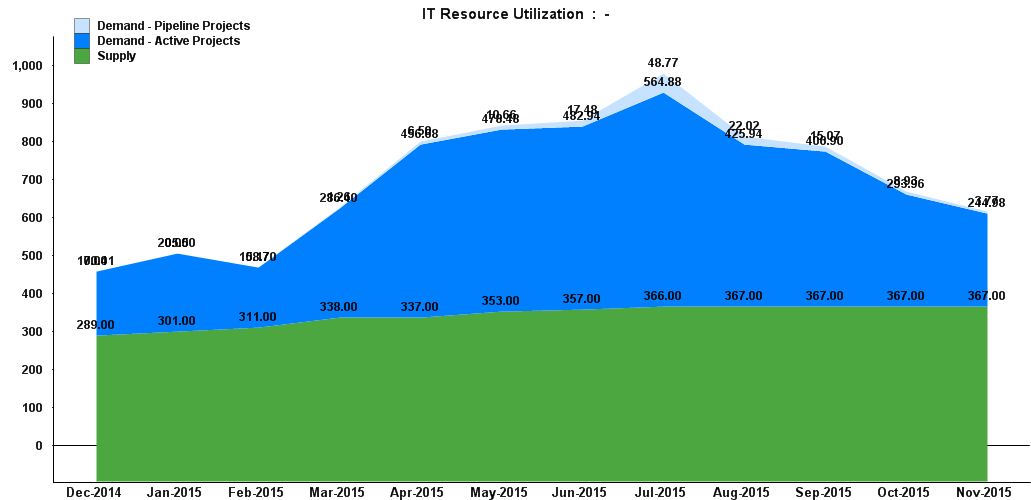
- Mark as New
- Bookmark
- Subscribe
- Mute
- Subscribe to RSS Feed
- Permalink
- Report Inappropriate Content
Not clear. Could you share a sample qvw?
- Mark as New
- Bookmark
- Subscribe
- Mute
- Subscribe to RSS Feed
- Permalink
- Report Inappropriate Content
Can you share a sample qvw?
- Mark as New
- Bookmark
- Subscribe
- Mute
- Subscribe to RSS Feed
- Permalink
- Report Inappropriate Content
I have 2 expression as below
1) Supply - ceil(sum({<[Project Name]=,[Project Delivery Status]=>}Supply_HCM))
2) Active Demand - ceil(sum(if(PlanType='Demand' and ([Project Delivery Status] = 'Initiated' or [Project Delivery Status] = 'In Progress') ,Demand_HCM)))
3) Pipeline Demand - ceil(sum(if([Project Delivery Status]='On Hold' or [Project Delivery Status] = 'Not Started',Demand_HCM)))
Please elaborate what needs to done in the expression tab with the above given expressions.. I have selected the 2nd option under Style from the left bottom.
- Mark as New
- Bookmark
- Subscribe
- Mute
- Subscribe to RSS Feed
- Permalink
- Report Inappropriate Content
Added qv file and the base files
- Mark as New
- Bookmark
- Subscribe
- Mute
- Subscribe to RSS Feed
- Permalink
- Report Inappropriate Content
See attached file for what I meant. Does that make sense? I am not sure if I fully understand, but look at it. You can also play around with the transparancy of the colors.
Bets,
AA !
- « Previous Replies
-
- 1
- 2
- Next Replies »