Unlock a world of possibilities! Login now and discover the exclusive benefits awaiting you.
- Qlik Community
- :
- All Forums
- :
- QlikView App Dev
- :
- Straight table vs Pivot Table
- Subscribe to RSS Feed
- Mark Topic as New
- Mark Topic as Read
- Float this Topic for Current User
- Bookmark
- Subscribe
- Mute
- Printer Friendly Page
- Mark as New
- Bookmark
- Subscribe
- Mute
- Subscribe to RSS Feed
- Permalink
- Report Inappropriate Content
Straight table vs Pivot Table
Hi All
2 questions in one:
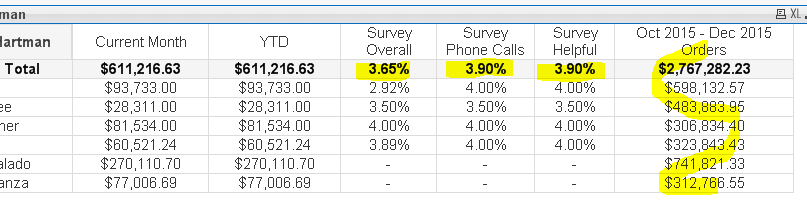
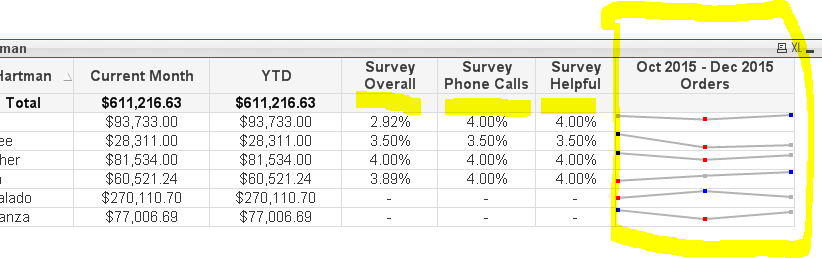
Why totals that show in Pivot table (highlighted in first screen shot) do not show in a straight table (second screen shot)
And why Mini Chart as in a straight table (framed highlighted in second screen shot ) is not available in a Pivot table?
In a pivot table it gives the total of the three months in question.
(All are calculated the same just changed from Straight to Pivot)
This is a pivot table
This is a straight table
Thanks
- Tags:
- new_to_qlikview
Accepted Solutions
- Mark as New
- Bookmark
- Subscribe
- Mute
- Subscribe to RSS Feed
- Permalink
- Report Inappropriate Content
For the last Column you can change the Representation to 'Text' from 'Mini Chart'
- Mark as New
- Bookmark
- Subscribe
- Mute
- Subscribe to RSS Feed
- Permalink
- Report Inappropriate Content
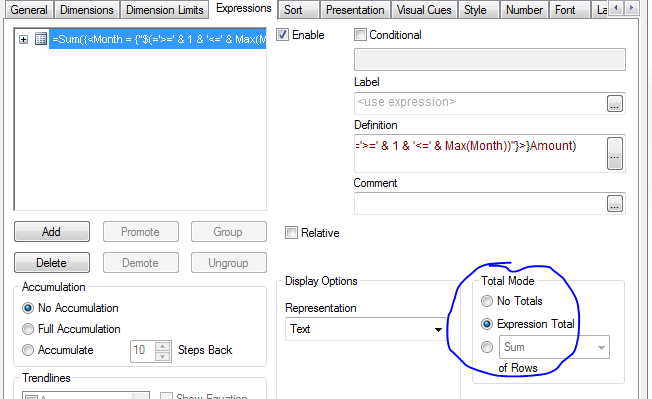
May be the totals for those three expressions are not enabled on the expressions tab. Make sure it is set to either Expression Total or Third option to be able to view a total up top.
- Mark as New
- Bookmark
- Subscribe
- Mute
- Subscribe to RSS Feed
- Permalink
- Report Inappropriate Content
For the last Column you can change the Representation to 'Text' from 'Mini Chart'
- Mark as New
- Bookmark
- Subscribe
- Mute
- Subscribe to RSS Feed
- Permalink
- Report Inappropriate Content
You are a genius!
I completely neglected those.
Thanks
- Mark as New
- Bookmark
- Subscribe
- Mute
- Subscribe to RSS Feed
- Permalink
- Report Inappropriate Content
And the answer to your second question: Mini-charts are available only in Straight Tables.
Check the Pivot Properties->Expressions->Representation list. No mini-charts.
Best,
Peter
- Mark as New
- Bookmark
- Subscribe
- Mute
- Subscribe to RSS Feed
- Permalink
- Report Inappropriate Content
Thanks
I learned that the hard way!!!