Unlock a world of possibilities! Login now and discover the exclusive benefits awaiting you.
- Qlik Community
- :
- All Forums
- :
- QlikView App Dev
- :
- Re: Straight table with if statement
- Subscribe to RSS Feed
- Mark Topic as New
- Mark Topic as Read
- Float this Topic for Current User
- Bookmark
- Subscribe
- Mute
- Printer Friendly Page
- Mark as New
- Bookmark
- Subscribe
- Mute
- Subscribe to RSS Feed
- Permalink
- Report Inappropriate Content
Straight table with if statement
Hi,
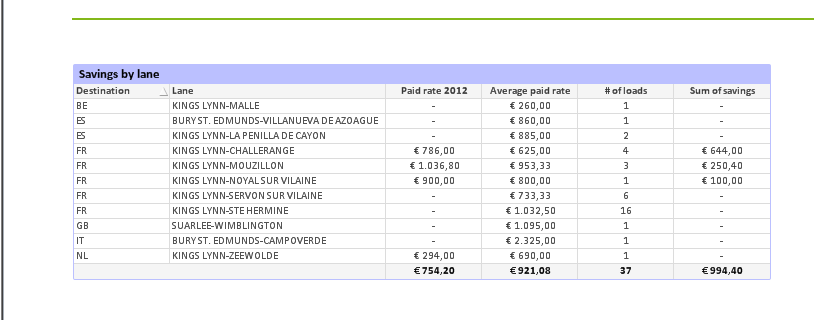
I am making a dashboard with several straight tables. One shows the savings . It looks as follows:
 .
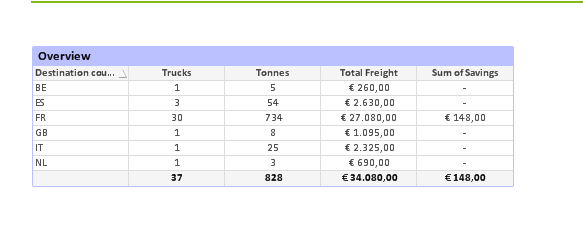
.
My data comes from two datasets; one set with all the shipment data from my company, and one file with the 2012 rates of the customer. I have Flagged our own data (because there are also many 2012 lanes in the file which are not relevant anymore) as ‘A’, and made the connection between the files based on "Lane".
For the table showing the savings I multiplied the average savings on a lane with the number of trucks on the lane. So I used the following formula:
=if(Avg({<FlagA={'A'}>}[2012 Rates in Eur])*count({<FlagA={'A'}>}Truck)-Sum({<FlagA={'A'}>}TotalFreight) <=0,null(),Avg({<FlagA={'A'}>}[2012 Rates in Eur])*count({<FlagA={'A'}>}Truck)-Sum({<FlagA={'A'}>}TotalFreight))
I use the if-statement, because the table should only show savings we created, not when we created extra costs for the customer
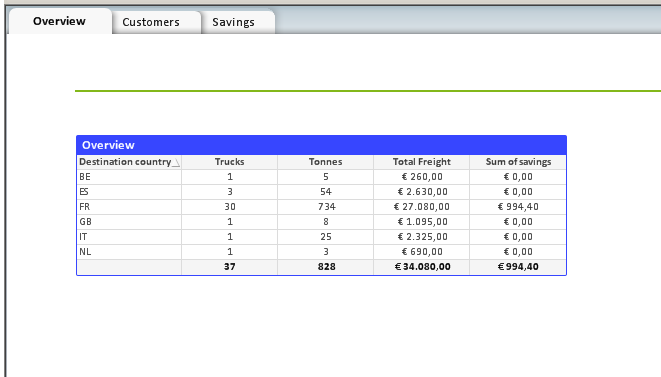
In this table I wanted to show the savings per Lane, but in the table “Overview” on the overview tab, I only want to show the total savings per country. The problem is, this formula doesn’t work here anymore; it should show 994,40 savings for France (and in total), but because now it does not calculate the savings for the separate lanes anymore, it right away calculates the average savings of all French lanes and multiplies this with all French trucks. So my results are as shown below:

I tried to solve this with the following aggregate formula:
=Aggr(if(Avg({<FlagA={'A'}>}[2012 Rates in Eur])*count({<FlagA={'A'}>}Truck)
-Sum({<FlagA={'A'}>}TotalFreight) <=0,null(),
Avg({<FlagA={'A'}>}[2012 Rates in Eur])*count({<FlagA={'A'}>}Truck)
-Sum({<FlagA={'A'}>}TotalFreight)),Lane)
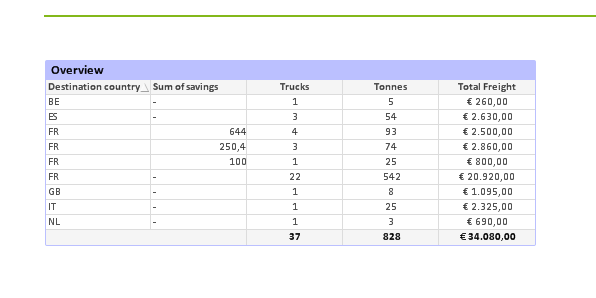
But now my table looks like this:

So with multiple times France as Origin country. And I’m also not able to do a sum of the total savings like this.
Can anybody help me solve this problem? Thanks!
Accepted Solutions
- Mark as New
- Bookmark
- Subscribe
- Mute
- Subscribe to RSS Feed
- Permalink
- Report Inappropriate Content
try to use
this formula
=sum(Aggr(if(Avg({<FlagA={'A'}>}[2012 Rates in Eur])*count({<FlagA={'A'}>}Truck)
-Sum({<FlagA={'A'}>}TotalFreight) <=0,null(),
Avg({<FlagA={'A'}>}[2012 Rates in Eur])*count({<FlagA={'A'}>}Truck)
-Sum({<FlagA={'A'}>}TotalFreight)),Lane,Destination_Country))
- Mark as New
- Bookmark
- Subscribe
- Mute
- Subscribe to RSS Feed
- Permalink
- Report Inappropriate Content
Hi Liron,
Yes that worked perfectly. Thank you so much!
