Unlock a world of possibilities! Login now and discover the exclusive benefits awaiting you.
- Qlik Community
- :
- All Forums
- :
- QlikView App Dev
- :
- Re: Target Line In Stacked Bar Chart
- Subscribe to RSS Feed
- Mark Topic as New
- Mark Topic as Read
- Float this Topic for Current User
- Bookmark
- Subscribe
- Mute
- Printer Friendly Page
- Mark as New
- Bookmark
- Subscribe
- Mute
- Subscribe to RSS Feed
- Permalink
- Report Inappropriate Content
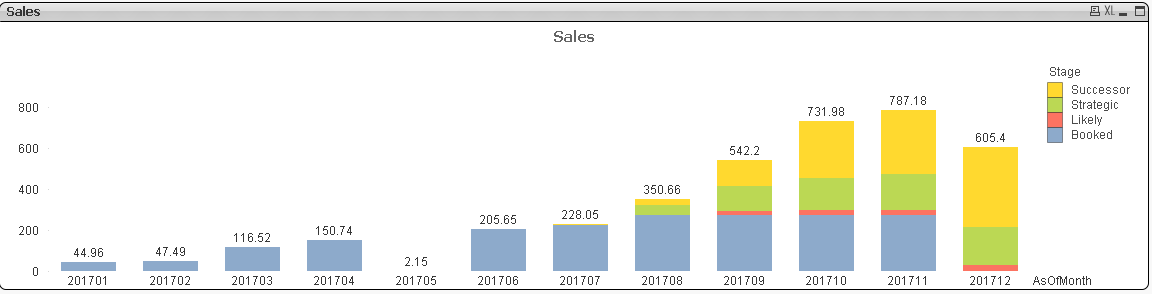
Target Line In Stacked Bar Chart
Hi Folks,
I'm having stacked bar chart like below:
Now I'm trying to show Target line by AsOfMonth as per below mapping:
load * Inline [
AsOfMonth, Target
201701, 81.186
201702, 93.886
201703, 125.378
201704, 98.453
201705, 6.937
201706, 128.632
201707, 62.659
201708, 9.026
201709, 6.164
201710, 6.386
201711, 19.101
201712, 21.695
];
To do this I'm calling second expression as sum(Sales) ,but chart now looks like below:
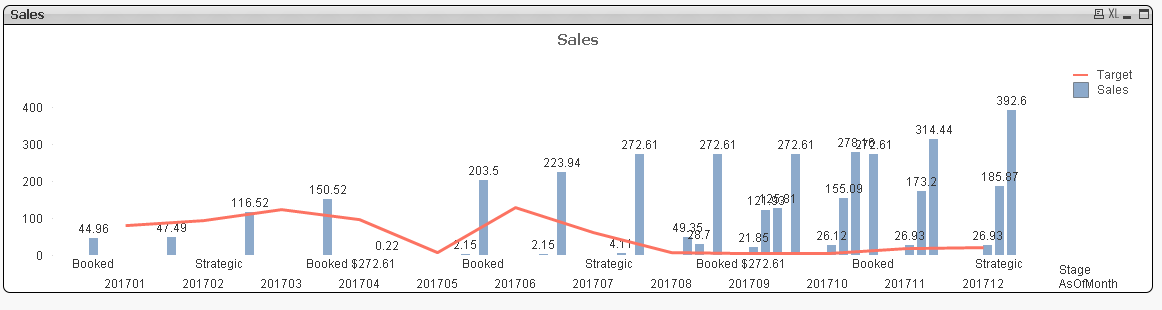
But this is not what I'm looking for , I want same first stacked bar chart in addition target line.
Any suggestions how this is possible ???
Attached is sample qvw.
Thanks,
AS
Accepted Solutions
- Mark as New
- Bookmark
- Subscribe
- Mute
- Subscribe to RSS Feed
- Permalink
- Report Inappropriate Content
- Mark as New
- Bookmark
- Subscribe
- Mute
- Subscribe to RSS Feed
- Permalink
- Report Inappropriate Content
see attached
hope this helps
- Mark as New
- Bookmark
- Subscribe
- Mute
- Subscribe to RSS Feed
- Permalink
- Report Inappropriate Content
You will need to keep only one Dimension and add one expression for each stack item in the chart
only then can you have a separate line in a stack chart
If a post helps to resolve your issue, please accept it as a Solution.