Unlock a world of possibilities! Login now and discover the exclusive benefits awaiting you.
- Qlik Community
- :
- All Forums
- :
- QlikView App Dev
- :
- Re: Timeline
- Subscribe to RSS Feed
- Mark Topic as New
- Mark Topic as Read
- Float this Topic for Current User
- Bookmark
- Subscribe
- Mute
- Printer Friendly Page
- Mark as New
- Bookmark
- Subscribe
- Mute
- Subscribe to RSS Feed
- Permalink
- Report Inappropriate Content
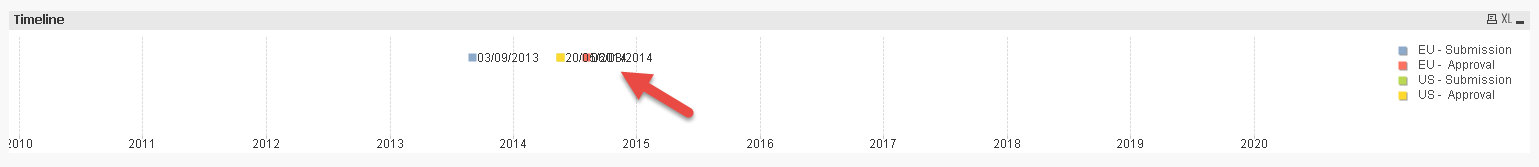
Timeline
Hi,
I have a timeline in my project, but the dates overlap, is there any way to fix this?
Grateful
- Mark as New
- Bookmark
- Subscribe
- Mute
- Subscribe to RSS Feed
- Permalink
- Report Inappropriate Content
u can press Cntrl+shift to move ur timeline or charts from with in chrt try this
- Mark as New
- Bookmark
- Subscribe
- Mute
- Subscribe to RSS Feed
- Permalink
- Report Inappropriate Content
Hi, Thanks,
this does not work, I'm sending a sample to see if it helps.
- Mark as New
- Bookmark
- Subscribe
- Mute
- Subscribe to RSS Feed
- Permalink
- Report Inappropriate Content
u can change the chart style to horizental
- Mark as New
- Bookmark
- Subscribe
- Mute
- Subscribe to RSS Feed
- Permalink
- Report Inappropriate Content
bcz ur chart expression dates all are in same year so the dates is shwng in same point...its too clumsy.
better u convert the chart to see the dates
- Mark as New
- Bookmark
- Subscribe
- Mute
- Subscribe to RSS Feed
- Permalink
- Report Inappropriate Content
Maybe something along this?
- Mark as New
- Bookmark
- Subscribe
- Mute
- Subscribe to RSS Feed
- Permalink
- Report Inappropriate Content
Attached another version, using a more sophisticated calculation to stack events vertically.
You can adjust the EventGroup calculation in the script to set max number of Events stacked vertically and the event proximity used for grouping.
![2016-04-15 21_09_52-QlikView x64 - [C__Users_Stefan_Downloads_TESTE_Timeline_2.qvw].png](/legacyfs/online/121808_2016-04-15 21_09_52-QlikView x64 - [C__Users_Stefan_Downloads_TESTE_Timeline_2.qvw].png)
- Mark as New
- Bookmark
- Subscribe
- Mute
- Subscribe to RSS Feed
- Permalink
- Report Inappropriate Content
Thanks for your help swuehl !
In my case, i have 4 columns in my database (xlsx), which it is the dates that i want to display in my chart.
How can i use these 4 fields of my database in this script that you shared??
It seems you are setting fix dates or aleatory dates in your script and showing in your chart.
In my project, i need to display the dates that come from my database, and could be changed anytime, depending on the selection of filters that user will apply.
Below you can see how i am using the fields of my data base in the expressions of my timeline chart:
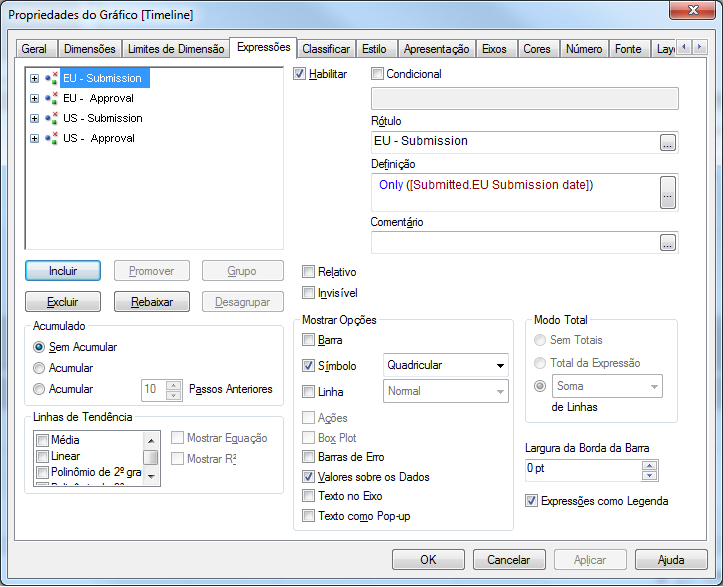
Does it make sense for you?
If not, i can share my qvw to help.
Many thanks!
- Mark as New
- Bookmark
- Subscribe
- Mute
- Subscribe to RSS Feed
- Permalink
- Report Inappropriate Content
Maybe like this