Unlock a world of possibilities! Login now and discover the exclusive benefits awaiting you.
- Qlik Community
- :
- All Forums
- :
- QlikView App Dev
- :
- Re: Top 3 values from the table?
- Subscribe to RSS Feed
- Mark Topic as New
- Mark Topic as Read
- Float this Topic for Current User
- Bookmark
- Subscribe
- Mute
- Printer Friendly Page
- Mark as New
- Bookmark
- Subscribe
- Mute
- Subscribe to RSS Feed
- Permalink
- Report Inappropriate Content
Top 3 values from the table?
I have table like
E.id, Basesalary
1, 1000
1, 2000
1, 3000
1, 5000
2, 2000
2, 3000
2, 4000
3,3000
3, 4000
4, 5000
4, 6000
Create a base salary table chart and highlight the top three with different colours. Use autogenerate number as id colum
Accepted Solutions
- Mark as New
- Bookmark
- Subscribe
- Mute
- Subscribe to RSS Feed
- Permalink
- Report Inappropriate Content
Did you try the expr i sent in your Qliksense? You want to display only top 3 in your table?
If yes, try calculated dimension like:
For your E.id dimension write the below
= Aggr(IF(Rank(Max(Basesalary),4,1)<4, E.id), E.id)
- Mark as New
- Bookmark
- Subscribe
- Mute
- Subscribe to RSS Feed
- Permalink
- Report Inappropriate Content
Add Straight table and add
Dim: E.id
Expr: = Max(BaseSalary)
then in expr background add
= Pick(Rank(max(Basesalary),4,1), LightGreen(), LightGray(), LightRed())
- Mark as New
- Bookmark
- Subscribe
- Mute
- Subscribe to RSS Feed
- Permalink
- Report Inappropriate Content
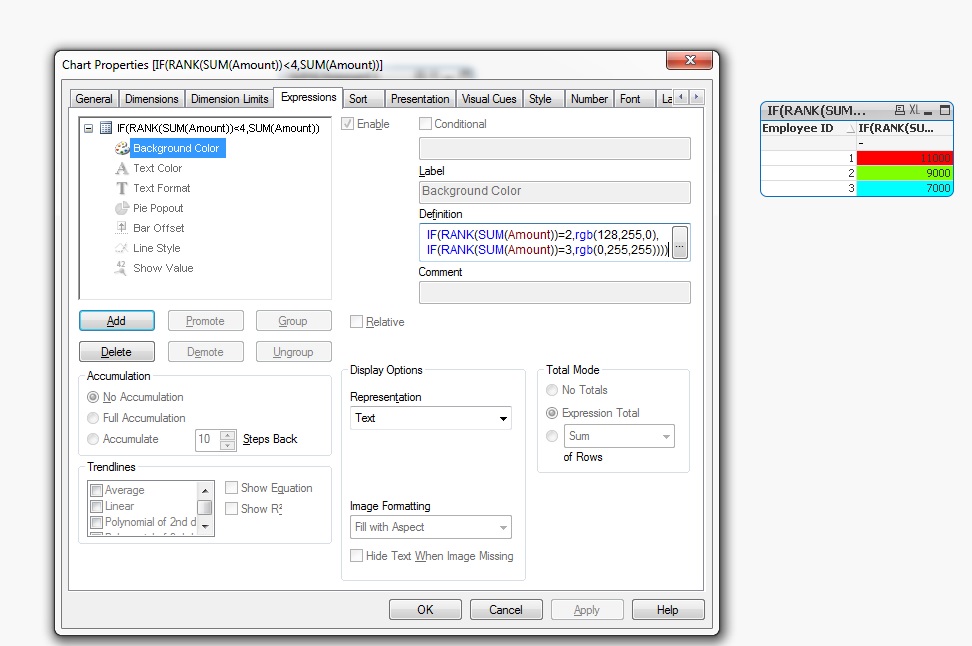
Expression:
IF(RANK(SUM(Amount))<4,SUM(Amount))
Background Expression:
IF(RANK(SUM(Amount))=1,rgb(255,0,0),
IF(RANK(SUM(Amount))=2,rgb(128,255,0),
IF(RANK(SUM(Amount))=3,rgb(0,255,255))))
- Mark as New
- Bookmark
- Subscribe
- Mute
- Subscribe to RSS Feed
- Permalink
- Report Inappropriate Content
Iam using QlikSense
- Mark as New
- Bookmark
- Subscribe
- Mute
- Subscribe to RSS Feed
- Permalink
- Report Inappropriate Content
Did you try the expr i sent in your Qliksense? You want to display only top 3 in your table?
If yes, try calculated dimension like:
For your E.id dimension write the below
= Aggr(IF(Rank(Max(Basesalary),4,1)<4, E.id), E.id)
- Mark as New
- Bookmark
- Subscribe
- Mute
- Subscribe to RSS Feed
- Permalink
- Report Inappropriate Content
yes, iam getting. But i want different colours.