Unlock a world of possibilities! Login now and discover the exclusive benefits awaiting you.
- Qlik Community
- :
- All Forums
- :
- QlikView App Dev
- :
- Using fields as filter
- Subscribe to RSS Feed
- Mark Topic as New
- Mark Topic as Read
- Float this Topic for Current User
- Bookmark
- Subscribe
- Mute
- Printer Friendly Page
- Mark as New
- Bookmark
- Subscribe
- Mute
- Subscribe to RSS Feed
- Permalink
- Report Inappropriate Content
Using fields as filter
Hello everyone,
I created a bar chart which displays the percentage of "Total Turnover", 'Voluntary Turnover" and "Involuntary Turnover" by Areas.
Areas is the dimension and i added 3 expressions, each one to display data of Total, Voluntary and Involuntary.
I would like to add a filter to show only values from Total or Voluntary or Involuntary, when i dont want to see all 3 expressions of my chart.
Anyone coulde help me on this?
Regards,
- Tags:
- new_to_qlikview
Accepted Solutions
- Mark as New
- Bookmark
- Subscribe
- Mute
- Subscribe to RSS Feed
- Permalink
- Report Inappropriate Content
You can use the conditional show function on expressions:
1. In the script create a listbox island
Island_Field:
LOAD * Inline [
FieldName
Total
Voluntary
Involuntary
];
2.
In your expressions tick conditional show and add the logic below:
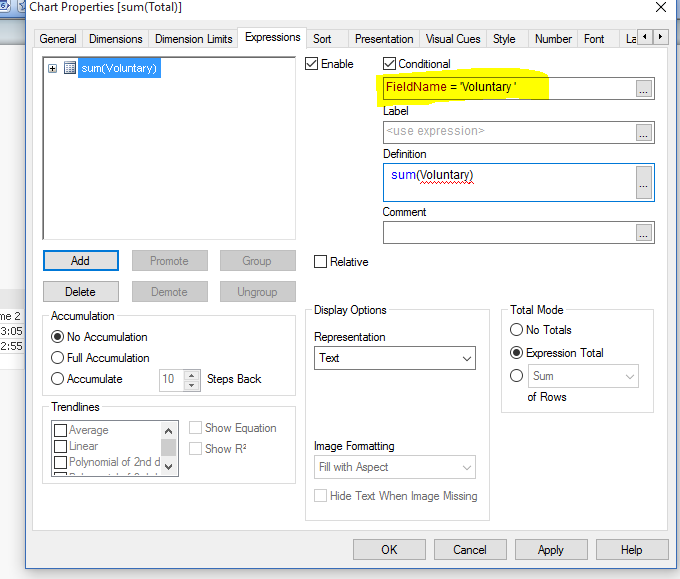
If you want it to show all 3 as default when nothing is selected in FieldName field then change the conditional expression to:
FieldName = 'Voluntary' or getselectedcount(FieldName) = 0
- Mark as New
- Bookmark
- Subscribe
- Mute
- Subscribe to RSS Feed
- Permalink
- Report Inappropriate Content
You should be able to conditionally show your expressions and the condition can be this:
=SubStringCount(Concat(DISTINCT ListBoxField, '|'), 'Total') = 1
=SubStringCount(Concat(DISTINCT ListBoxField, '|'), 'Voluntary') = 1
=SubStringCount(Concat(DISTINCT ListBoxField, '|'), 'Involuntary') = 1
Where ListBoxField is a field which include three rows
LOAD * Inline [
ListBoxField
Total
Voluntary
Involuntary
];
Now when you select Total, it would only show the expression 1 and so on...
- Mark as New
- Bookmark
- Subscribe
- Mute
- Subscribe to RSS Feed
- Permalink
- Report Inappropriate Content
You can use the conditional show function on expressions:
1. In the script create a listbox island
Island_Field:
LOAD * Inline [
FieldName
Total
Voluntary
Involuntary
];
2.
In your expressions tick conditional show and add the logic below:
If you want it to show all 3 as default when nothing is selected in FieldName field then change the conditional expression to:
FieldName = 'Voluntary' or getselectedcount(FieldName) = 0