Unlock a world of possibilities! Login now and discover the exclusive benefits awaiting you.
- Qlik Community
- :
- All Forums
- :
- QlikView App Dev
- :
- Re: Waterfall chart Issue
- Subscribe to RSS Feed
- Mark Topic as New
- Mark Topic as Read
- Float this Topic for Current User
- Bookmark
- Subscribe
- Mute
- Printer Friendly Page
- Mark as New
- Bookmark
- Subscribe
- Mute
- Subscribe to RSS Feed
- Permalink
- Report Inappropriate Content
Waterfall chart Issue
Hi Team,
We are trying to achieve waterfall chart using bar chart with 1 Dimension and 1 Expression.
Dimension is having 2 fix bar and others are dynamic based on Filter selection.
Logic is : last Bar = SUM of all bar.
we have achieved waterfall behavior as below.
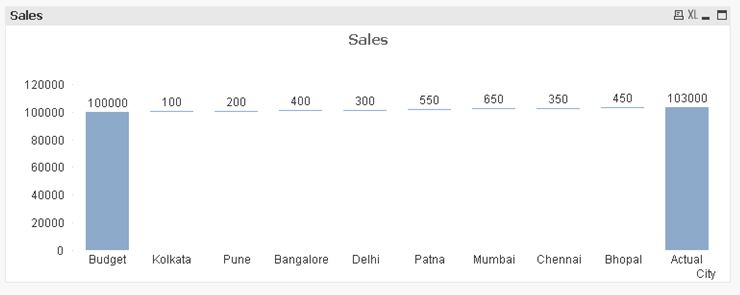
But the issue is, we have 2 bar with higher values, so respectively others are like simple line. So, we are trying to manipulate this to distinguish middle bars.
Option we tried:
Add some fraction of Budget and middle bars and same with offset.
After applied option:
Chart Behavior is not like waterfall chart.
Kindly help me out for this.
Thanks
Ravi Balar
- Mark as New
- Bookmark
- Subscribe
- Mute
- Subscribe to RSS Feed
- Permalink
- Report Inappropriate Content
Well, bars should really start on 0, but you can overrule this by disabling the Forced 0 setting of the Expression axis on the Axes tab of the properties window of the chart.
talk is cheap, supply exceeds demand
- Mark as New
- Bookmark
- Subscribe
- Mute
- Subscribe to RSS Feed
- Permalink
- Report Inappropriate Content
Thanks Gysbert. Actually, Forced 0 is not giving excepted output.
So we are trying with Min-Max Scaling.