Unlock a world of possibilities! Login now and discover the exclusive benefits awaiting you.
- Qlik Community
- :
- All Forums
- :
- QlikView App Dev
- :
- What is wrong with my chart as the numbers are WAY...
- Subscribe to RSS Feed
- Mark Topic as New
- Mark Topic as Read
- Float this Topic for Current User
- Bookmark
- Subscribe
- Mute
- Printer Friendly Page
- Mark as New
- Bookmark
- Subscribe
- Mute
- Subscribe to RSS Feed
- Permalink
- Report Inappropriate Content
What is wrong with my chart as the numbers are WAY off
I am try to make a line chart of what is currently a straight chart table.
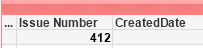
My table shows 412 items and I am attempting to line chart them over time.
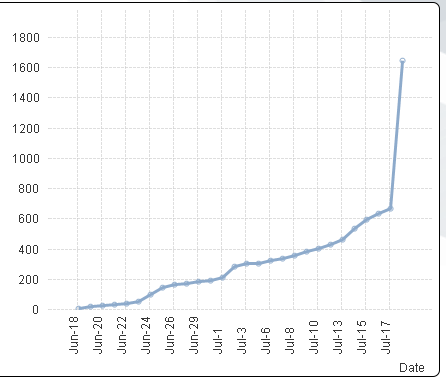
However, when I build the line chart (and turn on full accumulation so I can see the total number of issues), I get a number of 669, and a 'Date = -' field (with over 1600 issues) at the very right of the chart.
The expression I'm using is based on selections and is a simple Count(Variable). How are the numbers from the same exact set of selections so drastically different?
- « Previous Replies
-
- 1
- 2
- Next Replies »
- Mark as New
- Bookmark
- Subscribe
- Mute
- Subscribe to RSS Feed
- Permalink
- Report Inappropriate Content
Do you need a distinct count?
Is the figure correct with count( DISTINCT [Master ID])
- Mark as New
- Bookmark
- Subscribe
- Mute
- Subscribe to RSS Feed
- Permalink
- Report Inappropriate Content
Ok, turns out using my LDate field was where things were going wrong. Once I used a date field that pulled from only a single table, the DISTINCT gave me the right number.
Thanks for the help everyone.
- « Previous Replies
-
- 1
- 2
- Next Replies »