Unlock a world of possibilities! Login now and discover the exclusive benefits awaiting you.
- Qlik Community
- :
- All Forums
- :
- QlikView App Dev
- :
- YTD Calculation redefined
- Subscribe to RSS Feed
- Mark Topic as New
- Mark Topic as Read
- Float this Topic for Current User
- Bookmark
- Subscribe
- Mute
- Printer Friendly Page
- Mark as New
- Bookmark
- Subscribe
- Mute
- Subscribe to RSS Feed
- Permalink
- Report Inappropriate Content
YTD Calculation redefined

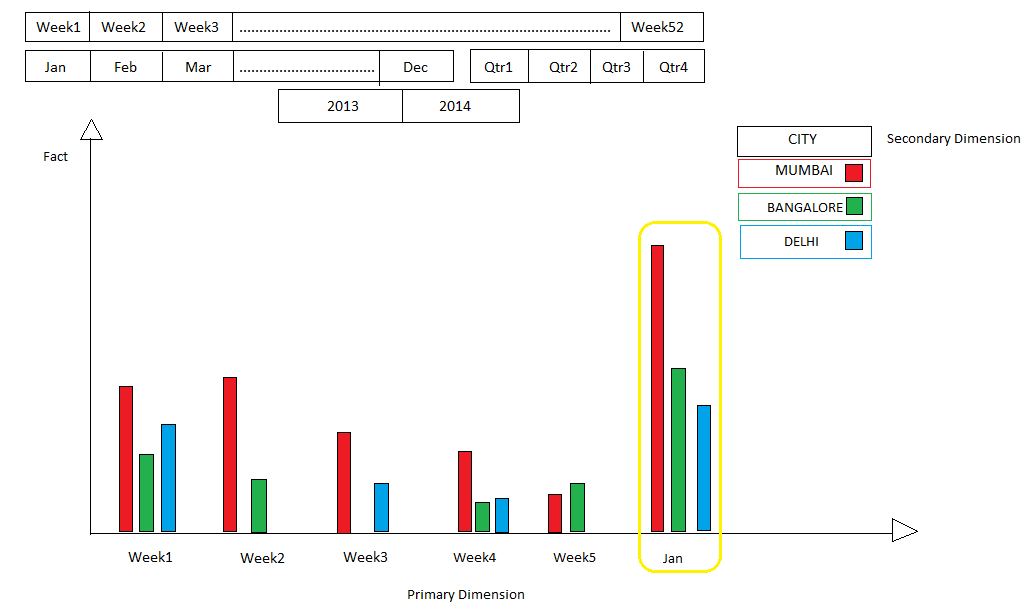
Contents of this image:
1. Year2013 and Year2014 (Text Box)
2. Quarter1 to Quarter4 (Text Box)
3. Month Jan to Month Dec (Text Box)
4. Week1 to Week52 (Text Box)
Fact: Ice Cream Sales
Primary Dimension: Week
Secondary Dimension: City
On selecting:
Step 1:Year 2013-->All quarters, months and weeks are intact
Step 2:Q1--> Jan, Feb, Mar are only displayed
or
Step 2:Jan--> Q1 is displayed
Step 3:only Week 1 to 5 are displayed
Another example
For 2013--> Q2--> Apr,May,Jun --> Apr is selected--> Week14 to Week18 should be displayed
On basis of the selections(for e.g. Jan) the Bar Chart should show week 1 to week 5 data and cumulative data for the month of Jan
Another example
If the selection (for e.g. Apr)the Bar Chart should show week 14 to week 18 data and cumulative data for month of Apr
Accepted Solutions
- Mark as New
- Bookmark
- Subscribe
- Mute
- Subscribe to RSS Feed
- Permalink
- Report Inappropriate Content
try to change the expression between "....." in set analysis
=sum({$<Month=,Quarter=,Week={">=$(=min(Week)) <=$(=max(Week))"}>} [Ice Cream Sales])
here a very good doc for set analysis
- Mark as New
- Bookmark
- Subscribe
- Mute
- Subscribe to RSS Feed
- Permalink
- Report Inappropriate Content
on the basis of what I understand from the post (you can also cumulate in the chart)
=sum({$<Month=,Quarter=,Week={"<=$(=max(Week))"}>} [Ice Cream Sales])
- Mark as New
- Bookmark
- Subscribe
- Mute
- Subscribe to RSS Feed
- Permalink
- Report Inappropriate Content
Hi, Massimo
Thank You but your logic works only for JAN
Moreover there is a slight change in the req.
2013-->Q1-->Jan
this selection should show W1,2,3,4,5 and Cumulative(Week 1,2,3,4,5)
2013-->Q1-->Feb
this selection should show W6,7,8,9 and Cumulative(Week 6,7,8,9)
and So on...
- Mark as New
- Bookmark
- Subscribe
- Mute
- Subscribe to RSS Feed
- Permalink
- Report Inappropriate Content
try to change the expression between "....." in set analysis
=sum({$<Month=,Quarter=,Week={">=$(=min(Week)) <=$(=max(Week))"}>} [Ice Cream Sales])
here a very good doc for set analysis