Unlock a world of possibilities! Login now and discover the exclusive benefits awaiting you.
- Qlik Community
- :
- All Forums
- :
- QlikView App Dev
- :
- Re: Re: bar chart & button combination problem
- Subscribe to RSS Feed
- Mark Topic as New
- Mark Topic as Read
- Float this Topic for Current User
- Bookmark
- Subscribe
- Mute
- Printer Friendly Page
- Mark as New
- Bookmark
- Subscribe
- Mute
- Subscribe to RSS Feed
- Permalink
- Report Inappropriate Content
bar chart & button combination problem
i have one bar chart and one button in that button two clicks are their one is current selection and another one is 12 months
if i click the current selection the bar chart it display the current seletion data . and once again click 12 months it display current selection-12 months data in bar chart.
i am calculating the both current selection and 12 months in bar chart . in button object wrote this code like if(vtogle_something='last',12months,current selection)
i m using this code to write the expression in bar chart like (if vtogle_some='last',
i don't next and also using the condition(expression like rate%)
count( if(op_status='won',op_status))/count(op_status) to display the bar chart corresponding clicks in one button object plz tell me the working expression........plz........urgent
- Tags:
- new_to_qlikview
- subbu
- Mark as New
- Bookmark
- Subscribe
- Mute
- Subscribe to RSS Feed
- Permalink
- Report Inappropriate Content
Can you post a sample QVW?
i kind of got your intention of the button click. It will be easy for me to solve in your sample QVW rather than me creating a sample.
- Mark as New
- Bookmark
- Subscribe
- Mute
- Subscribe to RSS Feed
- Permalink
- Report Inappropriate Content
how to write the expression in bar chart plz tell me......don't have any sample dashboard
- Mark as New
- Bookmark
- Subscribe
- Mute
- Subscribe to RSS Feed
- Permalink
- Report Inappropriate Content
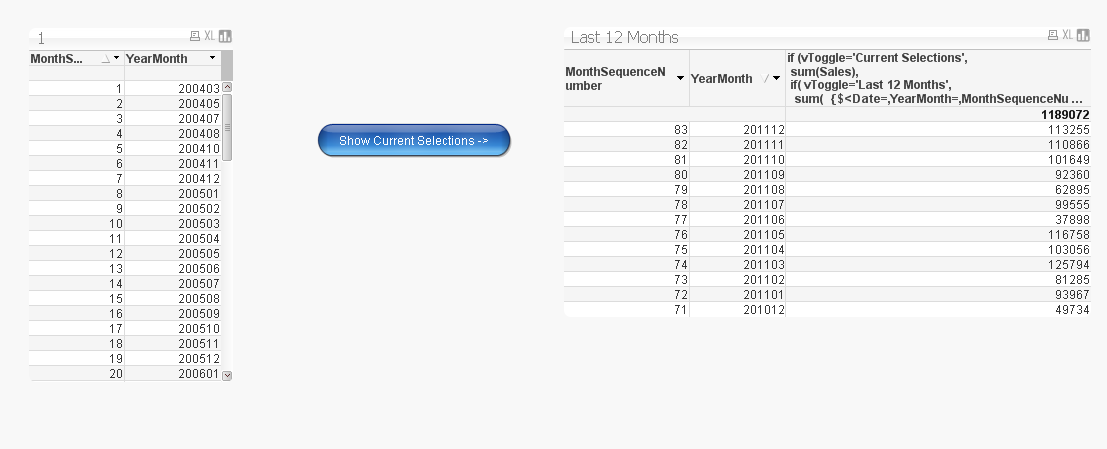
Here is a sample with the button you descibe and a conditional expression that shows the regular current selections vs only last 12 months
There are 2 buttons. They both set the variable vToggle. They both have a layout show/hide condition. The button that sets to 'current selections' only shows when vToggle='Last 12 Months' and vice versa.
I use a data calendar that numbers the months sequentially from oldest monthyear (1) to latest monthyear (in this case 83)
here is the load script:
Data:
LOAD
[Transaction ID],
Sales,
[Gross Margin],
Date,
year(Date)*100 + month(Date) as YearMonth
FROM
(txt, codepage is 1252, embedded labels, delimiter is ',', msq);
MonthCalendar:
load Distinct
AutoNumber(YearMonth) as MonthSequenceNumber,
YearMonth
Resident Data
Order by YearMonth Asc;
I have a variable that stores the current month:
vCurrentMonth: =max(MonthSequenceNumber)
The expression for last 12 months in the chart is
if (vToggle='Current Selections',
sum(Sales),
if( vToggle='Last 12 Months',
sum( {$<Date=,YearMonth=,MonthSequenceNumber={'>=$(=vCurrentMonth-12)'}>} Sales)
)
)
here are the screenshots

Then press ' show last 12 months' and get this:
(button is toggled and the chart is filterd to last 12 months)