Unlock a world of possibilities! Login now and discover the exclusive benefits awaiting you.
- Qlik Community
- :
- All Forums
- :
- QlikView App Dev
- :
- Re: chart drill through
- Subscribe to RSS Feed
- Mark Topic as New
- Mark Topic as Read
- Float this Topic for Current User
- Bookmark
- Subscribe
- Mute
- Printer Friendly Page
- Mark as New
- Bookmark
- Subscribe
- Mute
- Subscribe to RSS Feed
- Permalink
- Report Inappropriate Content
chart drill through
Hi
another query on a chart.
The chart attached is showing data this year v previous 2 years but it is showing a total for all areas.
I need it to show total for each area if they are selected from the area list box.
Any help appreciated
R
Accepted Solutions
- Mark as New
- Bookmark
- Subscribe
- Mute
- Subscribe to RSS Feed
- Permalink
- Report Inappropriate Content
Your expression: =Sum({1<[ImmVacc 117] ={12},ReferredYYYY={'$(=Max(ReferredYYYY))'}>}ActualValue)
and [ImmVacc 117] seems to be blank in 2015 and you are using the set analysis statement to include only [ImmVacc 117] which equal 12.
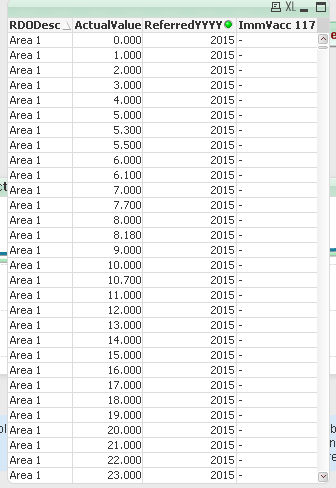
Otherwise to let your selections in Area work you can do something like this:
=Sum({1<[ImmVacc 117] ={12},ReferredYYYY={'$(=Max(ReferredYYYY))'}, RDODesc = p(RDODesc)>}ActualValue)
HTH
Best,
Sunny
- Mark as New
- Bookmark
- Subscribe
- Mute
- Subscribe to RSS Feed
- Permalink
- Report Inappropriate Content
Hi R, you can add a TOTAL clause per RDODesc and remove the {1} that ignores all selections, ie:
=Sum(TOTAL <RDODesc> {<[ImmVacc 117] ={12},ReferredYYYY={'$(=Max(ReferredYYYY)-1)'}>}ActualValue)
- Mark as New
- Bookmark
- Subscribe
- Mute
- Subscribe to RSS Feed
- Permalink
- Report Inappropriate Content
Your expression: =Sum({1<[ImmVacc 117] ={12},ReferredYYYY={'$(=Max(ReferredYYYY))'}>}ActualValue)
and [ImmVacc 117] seems to be blank in 2015 and you are using the set analysis statement to include only [ImmVacc 117] which equal 12.
Otherwise to let your selections in Area work you can do something like this:
=Sum({1<[ImmVacc 117] ={12},ReferredYYYY={'$(=Max(ReferredYYYY))'}, RDODesc = p(RDODesc)>}ActualValue)
HTH
Best,
Sunny
- Mark as New
- Bookmark
- Subscribe
- Mute
- Subscribe to RSS Feed
- Permalink
- Report Inappropriate Content
Thanks Sunindia that works great
R
- Mark as New
- Bookmark
- Subscribe
- Mute
- Subscribe to RSS Feed
- Permalink
- Report Inappropriate Content
I am glad it worked.
Best,
Sunny