Unlock a world of possibilities! Login now and discover the exclusive benefits awaiting you.
- Qlik Community
- :
- All Forums
- :
- QlikView App Dev
- :
- data table straight
- Subscribe to RSS Feed
- Mark Topic as New
- Mark Topic as Read
- Float this Topic for Current User
- Bookmark
- Subscribe
- Mute
- Printer Friendly Page
- Mark as New
- Bookmark
- Subscribe
- Mute
- Subscribe to RSS Feed
- Permalink
- Report Inappropriate Content
data table straight
Hi, I have a question,
i have a percentage filter with a data like this :
I want to show data based on percentage filter. let's say i input percentage. So i want to check quantity for each person per brand. If at least one brand is in the range of my selection, so i want to show all the data of person one. For the data above the result i expect is like this
I have try using calculated dimension and it runs perfectly, but the data load performance is so poor (very slow) when i use large data. I also attach the qvw file for what i've done before.
- Tags:
- new_to_qlikview
- « Previous Replies
-
- 1
- 2
- Next Replies »
Accepted Solutions
- Mark as New
- Bookmark
- Subscribe
- Mute
- Subscribe to RSS Feed
- Permalink
- Report Inappropriate Content
Hi,
Please find attached file for solution. Changed script and arrived one file.
Regards,
Jagan.
- Mark as New
- Bookmark
- Subscribe
- Mute
- Subscribe to RSS Feed
- Permalink
- Report Inappropriate Content
this is my qvw file
- Mark as New
- Bookmark
- Subscribe
- Mute
- Subscribe to RSS Feed
- Permalink
- Report Inappropriate Content
Hi,
Try this expressions
Qty1: If(sum(Qty2)/sum(Qty1) >= percenFrom/100 AND sum(Qty2)/sum(Qty1) <= percenTo/100,sum(Qty1))
Qty2: If(sum(Qty2)/sum(Qty1) >= percenFrom/100 AND sum(Qty2)/sum(Qty1) <= percenTo/100,sum(Qty2))
% = If(sum(Qty2)/sum(Qty1) >= percenFrom/100 AND sum(Qty2)/sum(Qty1) <= percenTo/100, sum(Qty2)/sum(Qty1))
And select Supress zero values option in Presentation tab of the chart.
Hope this helps you.
Regards,
Jagan.
- Mark as New
- Bookmark
- Subscribe
- Mute
- Subscribe to RSS Feed
- Permalink
- Report Inappropriate Content
Hi Jagan,
Thanks for your suggestion, but i can't use that expression.
Your expression will return this :
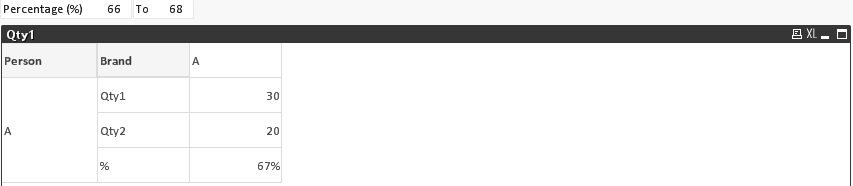
It only show brand A, i want to show all brand if at least one brand percentage between the input range.
Do you have any idea ?
The filter is only check the percentage for each brand, if at least one brand is between the range, so i want to show all the data of person A.
Thanks
- Mark as New
- Bookmark
- Subscribe
- Mute
- Subscribe to RSS Feed
- Permalink
- Report Inappropriate Content
Hi,
Try this.
change the vPersonEligibility variable like
=Concat(Distinct Aggr(If(
$(vPercentFormula)*100>=percenFrom and $(vPercentFormula)*100<=percenTo,
Person
),Person, Brand),','
)
Remove the Calculated Dimension.
In the expression like, sum({<Person={$(vPersonEligibility)}>}Qty1)
Find the reference attachment
- Mark as New
- Bookmark
- Subscribe
- Mute
- Subscribe to RSS Feed
- Permalink
- Report Inappropriate Content
Hi Settu,
i think it's a great idea Settu. But how if i have more than one dimension, not only Person, but also Area, OfficerName, etc.
When i'm using calculated dimension i'm using this expression for vPersonEligibility
=Concat(Aggr(If(
round($(percenFormula),'0.01')*100 >=percenFrom2 and round($(percenFormula),'0.01')*100 <= percenTo2,
Person & Area & OfficerName
),Person, Area, OfficerName, ITEM_BRAND)
)
but how if i change to your expression.?
In which part i must change ?
Logically i need to change the chart expression
sum({<Person={$(vPersonEligibility)}, Area = {...........}, OfficerName ={...............}>}Qty1)
thanks
- Mark as New
- Bookmark
- Subscribe
- Mute
- Subscribe to RSS Feed
- Permalink
- Report Inappropriate Content
I mean like this Settu,
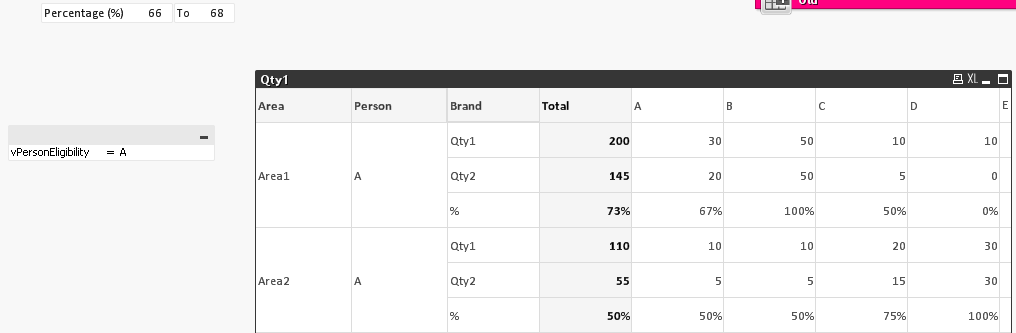
when i input 66-68 person A in Area1 must be shown, but person A in Area2 must not be shown.
The result i expect is only person A in Area1 that shown.
I also attach my file here.
is it possible to make it ?
thanks
- Mark as New
- Bookmark
- Subscribe
- Mute
- Subscribe to RSS Feed
- Permalink
- Report Inappropriate Content
Hi,
Are you ok to create the variables based on Dimension?
like for Area
vAreaEligibility
=Concat(Distinct Aggr(If(
$(vPercentFormula)*100>=percenFrom and $(vPercentFormula)*100<=percenTo,
Area
),Person, Area,Brand),','
)
Expression:
sum({<Person={$(vPersonEligibility)},Area={$(vAreaEligibility)}>}Qty1)
Check the Attachment, may be helps
- Mark as New
- Bookmark
- Subscribe
- Mute
- Subscribe to RSS Feed
- Permalink
- Report Inappropriate Content
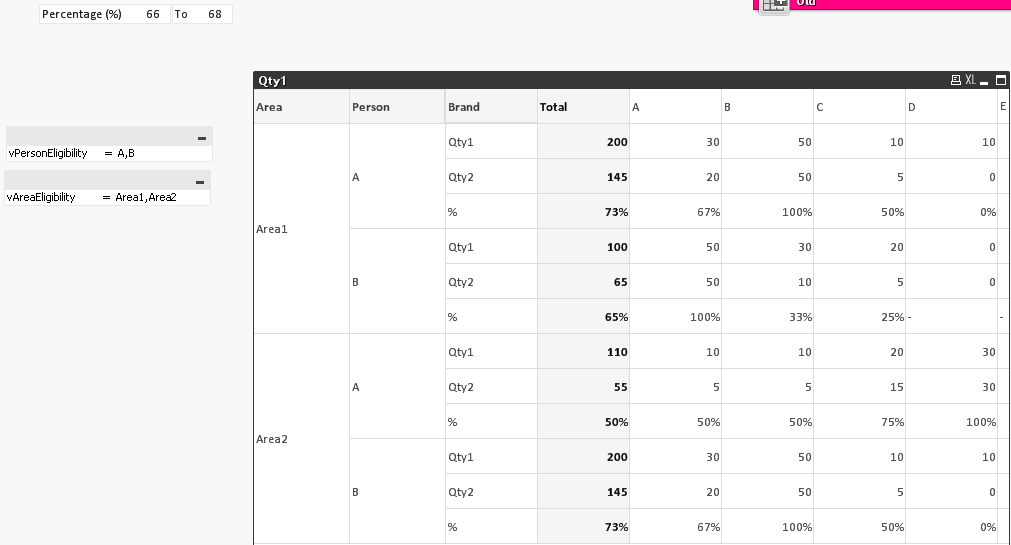
Hi Settu,
Really thanks for your great idea and response, but as far as i know it will return all values If i have a data like this scenario:
Area1 A 20%
B 50%
Area2 A 50%
B 20%
then I select 15-25 for percentage range
So vPersonEligibility will be {A,B}
vAreaEligibility will be {Area1,Area2}
sum({<Person={$(vPersonEligibility)},Area={$(vAreaEligibility)}>}Qty1)
so it will show
Area1 A 20%
B 50%
Area2 A 50%
B 20%
Is it right Settu ?
in the other side i want to show like this:
Area1 A 20%
Area2 B 20%
Thanks
- Mark as New
- Bookmark
- Subscribe
- Mute
- Subscribe to RSS Feed
- Permalink
- Report Inappropriate Content
I mean like this example Settu,
The result i expect is only show Area1-Person A and Area2-PersonB
Really sorry i ask you many question
i attach my example file here
Thanks Settu
- « Previous Replies
-
- 1
- 2
- Next Replies »