Unlock a world of possibilities! Login now and discover the exclusive benefits awaiting you.
- Qlik Community
- :
- All Forums
- :
- QlikView App Dev
- :
- how to calculate % of cases >= average
- Subscribe to RSS Feed
- Mark Topic as New
- Mark Topic as Read
- Float this Topic for Current User
- Bookmark
- Subscribe
- Mute
- Printer Friendly Page
- Mark as New
- Bookmark
- Subscribe
- Mute
- Subscribe to RSS Feed
- Permalink
- Report Inappropriate Content
how to calculate % of cases >= average
Hello,
could someone help me to solve the following issue. I am out of ideas ...
We have four categories of cases we are handling/closing : cars, moto, trucks, boats.
we can work multiples times on the same case in multiple days before closing it (e.g. case 2-1217060031),
The following expressions were used to create the table below:
Hours worked / Case =sum([Time worked])/count(distinct [Case Number])
number of cases =count(DISTINCT [Case Number])
| Category | Hours worked/case | number of cases | % cases =< average Hours worked (Hours worked/case) |
|---|---|---|---|
| Cars | 31,2 | 30 | ? |
| Moto | 92,2 | 22 | ? |
| Trucks | 162,1 | 11 | ? |
| Boats | 10,5 | 7 | ? |
| Total | 68,9 | 70 | ? |
How can I get the figures in the very right column?
I am addind excel file with my data.
Your help is really really appreciated.
Cheers,
Polina
- Mark as New
- Bookmark
- Subscribe
- Mute
- Subscribe to RSS Feed
- Permalink
- Report Inappropriate Content
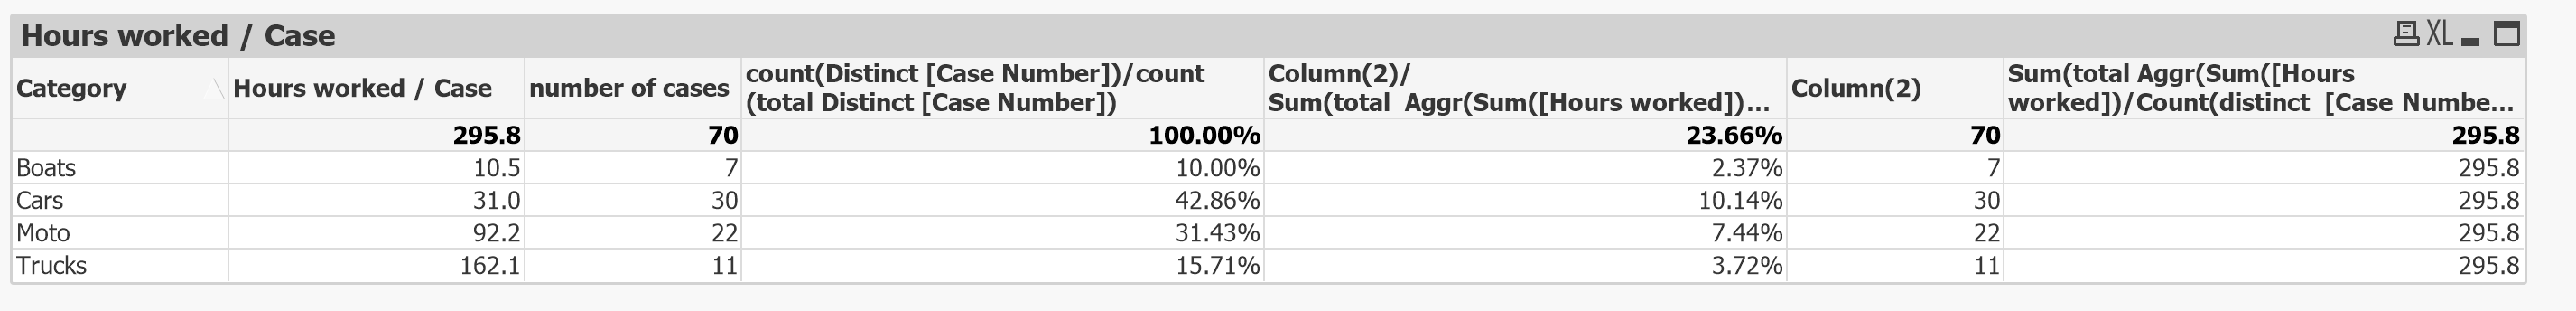
Do you need % of cases row wise to total of cases like this or something else -
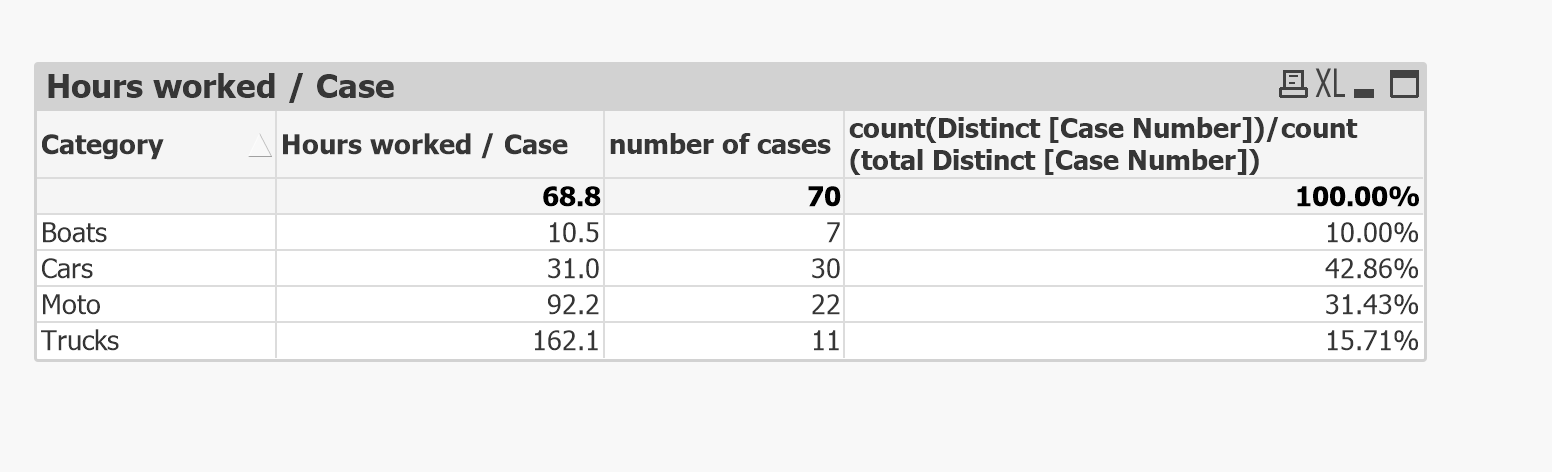
Or % of cases to total hours worked/per case
- Mark as New
- Bookmark
- Subscribe
- Mute
- Subscribe to RSS Feed
- Permalink
- Report Inappropriate Content
How are you converting hours worked to Time worked?
- Mark as New
- Bookmark
- Subscribe
- Mute
- Subscribe to RSS Feed
- Permalink
- Report Inappropriate Content
thanks for ideas, but that is not what I am searching for,
I've made calculations in excel:
Boats:
we have 7 distinct case numbers (out of 17lines). average time is 10 hours.
57% of all distinct cases were solved in <= average time for boats (4 out of 7)
Cars:
30 distinct case numbers (out of 74lines). average time is 31 hours.
70% of all distinct cases we solved in <= average time for cars (21 out of 30)
Moto:
22 distinct case numbers (out of 83lines). average time is 92.2 hours.
95% of all distinct cases we solved in <= average time for moto (21 out of 22).
Trucks:
11 distinct case numbers (out of 21 lines). average time is 162.1 hours.
91% of all distinct cases we solved in <= average time for trucks (10 out of 11).
So I need to have the values in the last column in qlikview:
Category / % of cases solved in time per category using the average time per category
Boats / 57%
Cars / 70%
Moto / 95%
Trucks / 91%
but I don't know how to...
- Mark as New
- Bookmark
- Subscribe
- Mute
- Subscribe to RSS Feed
- Permalink
- Report Inappropriate Content
that is also a good question as I don't convert anything . Is there a way to convert the values in received excel file saying the value in cell (seen as text in excel) should be converted to hh:mm:ss?