Unlock a world of possibilities! Login now and discover the exclusive benefits awaiting you.

- Qlik Community
- :
- All Forums
- :
- QlikView
- :
- Manipulating / Custom Dimension in Chart using Val...
- Subscribe to RSS Feed
- Mark Topic as New
- Mark Topic as Read
- Float this Topic for Current User
- Bookmark
- Subscribe
- Mute
- Printer Friendly Page

 shaan007
- Mark as New
- Bookmark
- Subscribe
- Mute
- Subscribe to RSS Feed
- Permalink
- Report Inappropriate Content
Manipulating / Custom Dimension in Chart using ValueList
Dimension
Field Name : Group
Dimension: | Expression: |
Group | =Sum(Value) |
A | 200 |
B | 300 |
C | 500 |
D | 1500 |
The Group D sharing 60% as D1 and 40% D2. I want the count(value) to split the D into D1 and D2 and show that in a chart.
Dimension: | Expression: | |
Group | =Sum(Value) | |
A | 200 | |
B | 300 | |
C | 500 | |
D | D1 | 900 |
D2 | 600 | |
I want the chart to show that as the attached image.
please anyone help.
Message was edited by: Prasanna Balachandran

- « Previous Replies
-
- 1
- 2
- Next Replies »
Accepted Solutions

 tresB
tresB
- Mark as New
- Bookmark
- Subscribe
- Mute
- Subscribe to RSS Feed
- Permalink
- Report Inappropriate Content
Basic logic(which could be optimized, may be using variables) is something like:
Dimension: =ValueList('A','B','C','D1','D2')
Expression:
=
Pick(Match(ValueList('A','B','C','D1','D2'), 'A','B','C','D1','D2'),
Sum({<[Dimension:]={"A"}>}[Expression:]),
Sum({<[Dimension:]={"B"}>}[Expression:]),
Sum({<[Dimension:]={"C"}>}[Expression:]),
Sum({<[Dimension:]={"D"}>}[Expression:])*0.6,
Sum({<[Dimension:]={"D"}>}[Expression:])*0.4
)
PFA
 jagan
jagan
- Mark as New
- Bookmark
- Subscribe
- Mute
- Subscribe to RSS Feed
- Permalink
- Report Inappropriate Content
Hi,
This is not possible in front end, instead you try in backend like this
DataTemp:
LOAD
Group,
Value
FROM DataSource;
LEFT JOIN
LOAD
*
INLINE [
Group, DummyDim
D, D1
D, D2
];
Data:
NoConcatenate
LOAD
Group,
DummyDim,
Value * If(DummyDim = 'D1', 0.6, If(DummyDim = 'D2', 0.4, 1) AS Value
Resident DataTemp;
DROP TABLE DataTemp;
Now in chart just use
Dimension: Group, DummyDim
Expression: Sum(Value)
Hope this helps you.
Regards,
Jagan.
tresB
- Mark as New
- Bookmark
- Subscribe
- Mute
- Subscribe to RSS Feed
- Permalink
- Report Inappropriate Content
Basic logic(which could be optimized, may be using variables) is something like:
Dimension: =ValueList('A','B','C','D1','D2')
Expression:
=
Pick(Match(ValueList('A','B','C','D1','D2'), 'A','B','C','D1','D2'),
Sum({<[Dimension:]={"A"}>}[Expression:]),
Sum({<[Dimension:]={"B"}>}[Expression:]),
Sum({<[Dimension:]={"C"}>}[Expression:]),
Sum({<[Dimension:]={"D"}>}[Expression:])*0.6,
Sum({<[Dimension:]={"D"}>}[Expression:])*0.4
)
PFA
shaan007
- Mark as New
- Bookmark
- Subscribe
- Mute
- Subscribe to RSS Feed
- Permalink
- Report Inappropriate Content
Thank you Tressco
,
Only Problem is... if the Group Filed get updated(example add new groups such as 'F', 'G'
then I have to Update the expression too.
anyways thanks a lot
shaan007
- Mark as New
- Bookmark
- Subscribe
- Mute
- Subscribe to RSS Feed
- Permalink
- Report Inappropriate Content
Perfect, let me test this and get back to u soon.
jagan
- Mark as New
- Bookmark
- Subscribe
- Mute
- Subscribe to RSS Feed
- Permalink
- Report Inappropriate Content
Hi,
Is above solution worked for you?
Regards,
Jagan.
shaan007
- Mark as New
- Bookmark
- Subscribe
- Mute
- Subscribe to RSS Feed
- Permalink
- Report Inappropriate Content
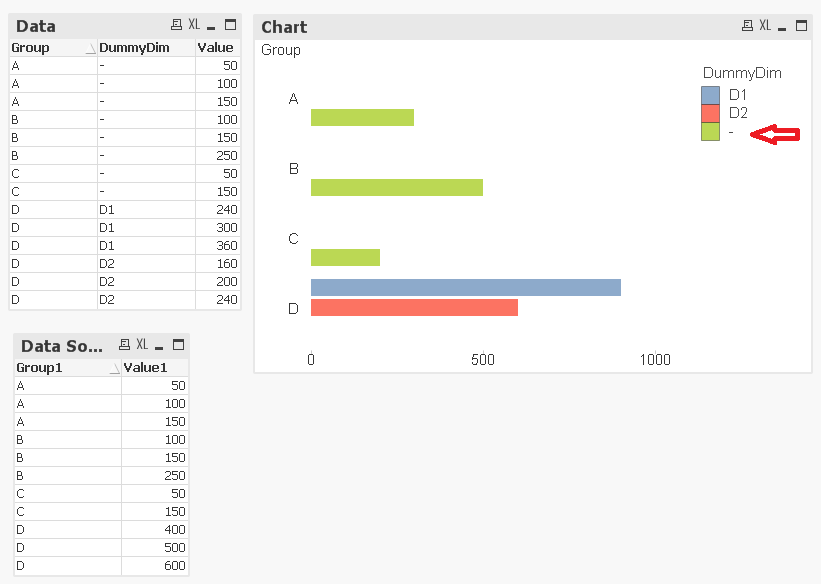
Hi jagan, ur approach is working, Only problem is the Legend,
shaan007
- Mark as New
- Bookmark
- Subscribe
- Mute
- Subscribe to RSS Feed
- Permalink
- Report Inappropriate Content
HI Tresco,
I encounter another issue while using your method.
selection on chat is not working if i use value List.
I do understand why this is happening. Any suggestion or tricks?
jagan
- Mark as New
- Bookmark
- Subscribe
- Mute
- Subscribe to RSS Feed
- Permalink
- Report Inappropriate Content
Hi,
ValueList is a Synthetic Dimension so it is not possible to filter, try like this
Chart Properties -> Dimensions -> Select Supress When Value is Null for DummyDim.
Hope this helps you.
Regards,
Jagan.
shaan007
- Mark as New
- Bookmark
- Subscribe
- Mute
- Subscribe to RSS Feed
- Permalink
- Report Inappropriate Content
Nandri for the reply Jagan.
Suppress When Value is Null for DummyDim didn't work, It will hide all other A,B,C .
I need a way to edit or customize the Legend.
Or else I may use text Object .
thank you

- « Previous Replies
-
- 1
- 2
- Next Replies »