Unlock a world of possibilities! Login now and discover the exclusive benefits awaiting you.

- Qlik Community
- :
- All Forums
- :
- QlikView
- :
- Re: Scatter Chart
- Subscribe to RSS Feed
- Mark Topic as New
- Mark Topic as Read
- Float this Topic for Current User
- Bookmark
- Subscribe
- Mute
- Printer Friendly Page

- Mark as New
- Bookmark
- Subscribe
- Mute
- Subscribe to RSS Feed
- Permalink
- Report Inappropriate Content
Scatter Chart
Hi ,
I have a requirement to built a scatter chart
with quarter as x-axis and salesamount as Y axis
Country as dimension ,
we have to use 2 expressions and 1 dimension in creating a scatter chart
Problem I am facing is I want quarter to be displayed as q1, q2,q3 on X axis
Is it possible to create a chart with quarter as x-axis
please find the attached file
Thanks
- Mark as New
- Bookmark
- Subscribe
- Mute
- Subscribe to RSS Feed
- Permalink
- Report Inappropriate Content
yes it is possible...create a field for quarter and use it as dimension
'Q'&ceil(month(MTH_DATE)/3) as [QuarterNo]

 maxgro
- Mark as New
- Bookmark
- Subscribe
- Mute
- Subscribe to RSS Feed
- Permalink
- Report Inappropriate Content
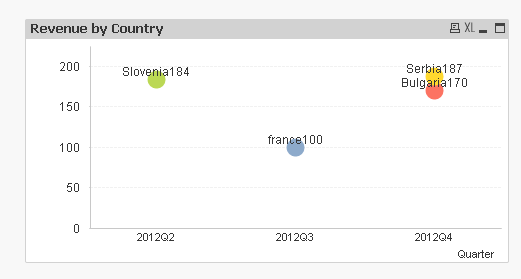
see attachment
not a scatter

 Josh_Good
- Mark as New
- Bookmark
- Subscribe
- Mute
- Subscribe to RSS Feed
- Permalink
- Report Inappropriate Content
For a scatter plot you need the x and y axis to be numeric. In your data the Quarter are text. A better approach would be to use a line chart and display the points as symbols without a line. If you really really need to use a scatter plot then this can be done by converting the quarters to number. In your case the expression RIGHT([Quarter],1) will work.
-Josh