Unlock a world of possibilities! Login now and discover the exclusive benefits awaiting you.
- Qlik Community
- :
- All Forums
- :
- QlikView
- :
- Re: Top 10 Values for Each Year Quarter
- Subscribe to RSS Feed
- Mark Topic as New
- Mark Topic as Read
- Float this Topic for Current User
- Bookmark
- Subscribe
- Mute
- Printer Friendly Page
- Mark as New
- Bookmark
- Subscribe
- Mute
- Subscribe to RSS Feed
- Permalink
- Report Inappropriate Content
Top 10 Values for Each Year Quarter
Hi,
I would want to see the the top 10 Values for Each YearQuarter in the Same Chart.
I did try doing it on a straight table by sorting the values based on the expression and displaying the 10 values.
But this combines the values of both the YearQtr Data(i.e., 2015Q4 and 2016Q1) and shows me a consolidated list of 10 rows.
But then I need to get the Top 10 Values for each of the YearQtr i.e., 20 rows meaning 10 rows for each YearQtr .
Can anyone please let me know how it could be done.
Attached is a sample file for reference
Accepted Solutions
- Mark as New
- Bookmark
- Subscribe
- Mute
- Subscribe to RSS Feed
- Permalink
- Report Inappropriate Content
Check this,
May be using,Your Dimension and hiding others.
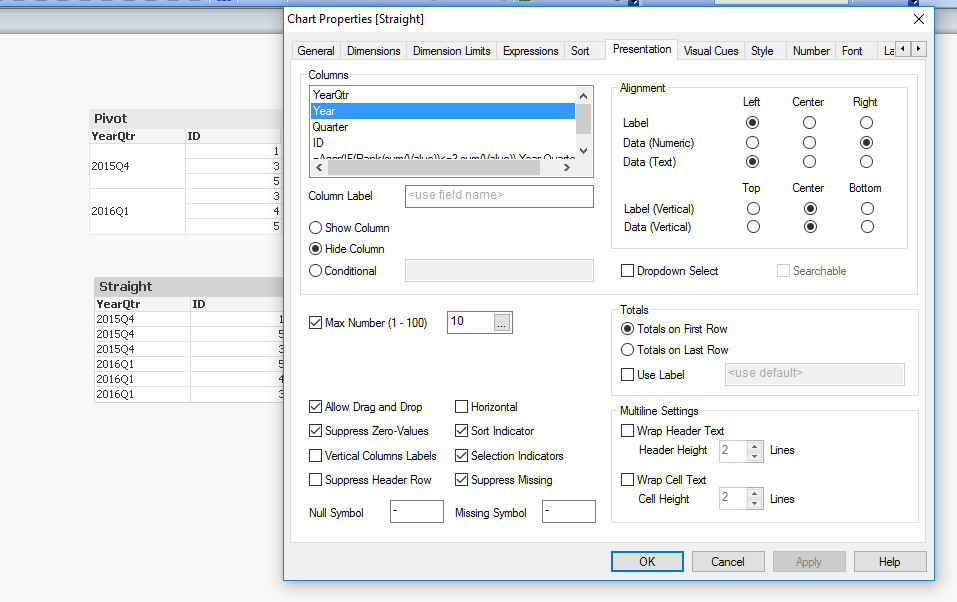
HTH,
PFA,
Hirish
- Mark as New
- Bookmark
- Subscribe
- Mute
- Subscribe to RSS Feed
- Permalink
- Report Inappropriate Content
- Mark as New
- Bookmark
- Subscribe
- Mute
- Subscribe to RSS Feed
- Permalink
- Report Inappropriate Content
Hi,
Check this, In pivot table by grouping and in straight table by using aggr,
Using your data,
Data:
LOAD YearQtr,
Left(YearQtr,4) AS Year,
Right(YearQtr,2) as Quarter,
ID,
     Value
FROM
[Top 10 YearQtr Sort.xlsx]
(ooxml, embedded labels, table is Sheet1);
At front end for ,Straight table,
=IF(Rank(sum(Value))<=3,sum(Value))
as expression,shows following,Below:
At front end for ,Pivot table,
=Aggr(IF(Rank(sum(Value))<=3,sum(Value)),Year,Quarter,ID)
as expression,shows following,Below:
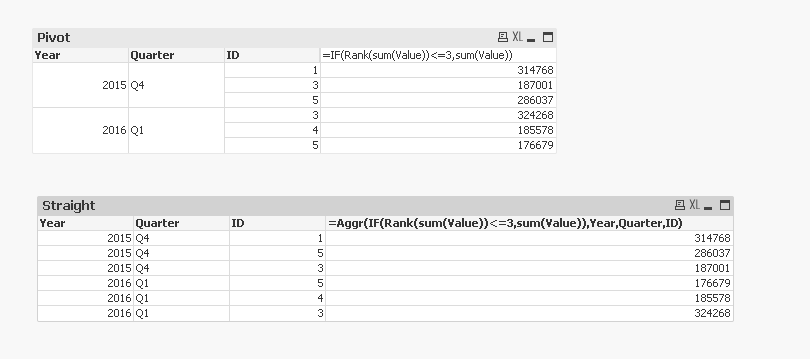
is this what your'e looking for, or let me know your'e requirement further.
HTH,
PFA,
Hirish
- Mark as New
- Bookmark
- Subscribe
- Mute
- Subscribe to RSS Feed
- Permalink
- Report Inappropriate Content
Ya but I do not want to show a split I would rather want to show the data as 2015q4 and 2016q1 rathher than splitting it into two columns as Year and Quarter
- Mark as New
- Bookmark
- Subscribe
- Mute
- Subscribe to RSS Feed
- Permalink
- Report Inappropriate Content
Then just use YearQtr instead of Year and Qtr in table dimensions and Aggr? As far as I can see splitting YearQtr into 2 fields is not essential for this solution.
- Mark as New
- Bookmark
- Subscribe
- Mute
- Subscribe to RSS Feed
- Permalink
- Report Inappropriate Content
Check this,
May be using,Your Dimension and hiding others.
HTH,
PFA,
Hirish