Unlock a world of possibilities! Login now and discover the exclusive benefits awaiting you.
- Qlik Community
- :
- All Forums
- :
- QlikView
- :
- YTD graph aggr
- Subscribe to RSS Feed
- Mark Topic as New
- Mark Topic as Read
- Float this Topic for Current User
- Bookmark
- Subscribe
- Mute
- Printer Friendly Page
- Mark as New
- Bookmark
- Subscribe
- Mute
- Subscribe to RSS Feed
- Permalink
- Report Inappropriate Content
YTD graph aggr
Hi,
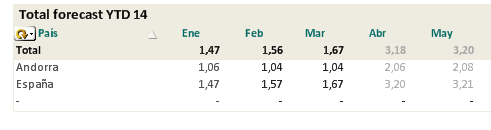
First of all I had the following problem with a pivot table, I have real sales data by country for different month: each row was a different country. The total was supossed to be the total for all countries but the total result was the max value of each row not the sum of rows.
The total of the YTD forecast in table is working ok (not in graph): The solutions for table is the following (not working for graph) : use AGGR(SET ANALYSIS)Country, Month.
I had the same problem for Graphs where I only had Month dimension, I triedd wit set anlysis, aggr function, total function but the total only work for simple realt data but it is not right for complex forecast data because the total that appears is the total of Spain.
It is not possible to use aggr function and set analysis for a graph with complex data as a forecast YTD average for each month (Fact1/Fact2). Any solution?
As you can see, the total is not working ok (it only shows Spain values) - the graph only shows Forecast and Ppto data:
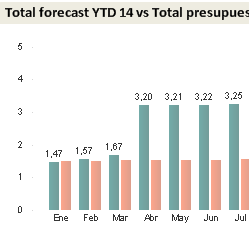
Is it not possible to use aggr function and set analysis for a graph with complex data as a forecast YTD average for each month. The calculated fact is like (Fact/Fact1) / (Fact2/Fact3).- Fact2/Fact3).- Any solution? I tried a lot of times and it doesn't works. Total or dimesionality functions are not working... Aggr and set analysis only works with January. What can I do with the other months?
I only could make possible the FORECAST DATA YTD for Spain with this formula:
IF(ValueList
('Ene','Feb','Mar','Abr','May','Jun','Jul','Ago','Sep','Oct','Nov','Dic')='Ene',
sum( {<Mes, ESTM_MES={01}>} OCUPACION)
/sum( {<Mes, ESTM_MES={01}>} ESTM_CH_MES)
,
IF(ValueList ('Ene','Feb','Mar','Abr','May','Jun','Jul','Ago','Sep','Oct','Nov','Dic')='Feb',
if($(vMesSelec)<= 02,
(sum( {<Mes, ESTM_MES={"$(= '>=' & '01' & '<=' & $(vMesSelec) )"}>} OCUPACION)/sum( {<Mes, ESTM_MES={"$(= '>=' & '01' & '<=' & $(vMesSelec) )"}>} ESTM_CH_MES))
,
(sum({<Mes, ESTM_MES={"$(= '>=' & '01' & '<=' &'02' )"}>} OCUPACION)/sum({<Mes, ESTM_MES={"$(= '>=' & '01' & '<=' &'02' )"}>} ESTM_CH_MES))
)
+ if($(vMesSelec)< 02,
(sum( {<Mes, ESTM_MES={"$(= '>' & $(vMesSelec) & '<=' & '02')"}>} OCUPACION_PRESU)
/sum( {<Mes, ESTM_MES={"$(= '>' & $(vMesSelec) & '<=' & '02')"}>} PRESU_COCHES_MES))
,0)
, .......
- Mark as New
- Bookmark
- Subscribe
- Mute
- Subscribe to RSS Feed
- Permalink
- Report Inappropriate Content
Hi Maria,
could you please attach an example qvw?
- Mark as New
- Bookmark
- Subscribe
- Mute
- Subscribe to RSS Feed
- Permalink
- Report Inappropriate Content
Here there is a sample. It's important that the total in this case is not the result of the sum of rows. The total shows the average of the total values, so TOTAL= SUM(ALL VALUES1) / SUM(ALL VALUES2). But the graph has to show the total for all countries (like the table). I tired Aggr and set analysis but it does not work.
The calculation must be done online (not in etl).