Unlock a world of possibilities! Login now and discover the exclusive benefits awaiting you.
- Qlik Community
- :
- Discover
- :
- About
- :
- Water Cooler
- :
- Re: Calculating a group of dates in same field
- Subscribe to RSS Feed
- Mark Topic as New
- Mark Topic as Read
- Float this Topic for Current User
- Bookmark
- Subscribe
- Mute
- Printer Friendly Page
- Mark as New
- Bookmark
- Subscribe
- Mute
- Subscribe to RSS Feed
- Permalink
- Report Inappropriate Content
Calculating a group of dates in same field
All ...
Here is the problem:
I need to either create a load script or an expression that perform a continuous rollup of data where each ID would have a show the accumulated amount month over month. Eventually, the data will be visualized. Any help is appreciated.
Source Data
| ID | Year | Month | Amount |
|---|---|---|---|
| A | 2010 | 201001 | 0 |
| A | 2010 | 201002 | 28 |
| A | 2010 | 201003 | 31 |
| B | 2010 | 201001 | 5 |
| A | 2010 | 201004 | 3 |
Expected Result
| ID | Year | Month | Amount |
|---|---|---|---|
| A | 2010 | 201001 | 0 |
| A | 2010 | 201002 | 28 |
| A | 2010 | 201003 | 59 |
| B | 2010 | 201001 | 5 |
| A | 2010 | 201004 | 62 |
Accepted Solutions
- Mark as New
- Bookmark
- Subscribe
- Mute
- Subscribe to RSS Feed
- Permalink
- Report Inappropriate Content
- Mark as New
- Bookmark
- Subscribe
- Mute
- Subscribe to RSS Feed
- Permalink
- Report Inappropriate Content
It seems like you want to do the same thing as this post: Rolling Count
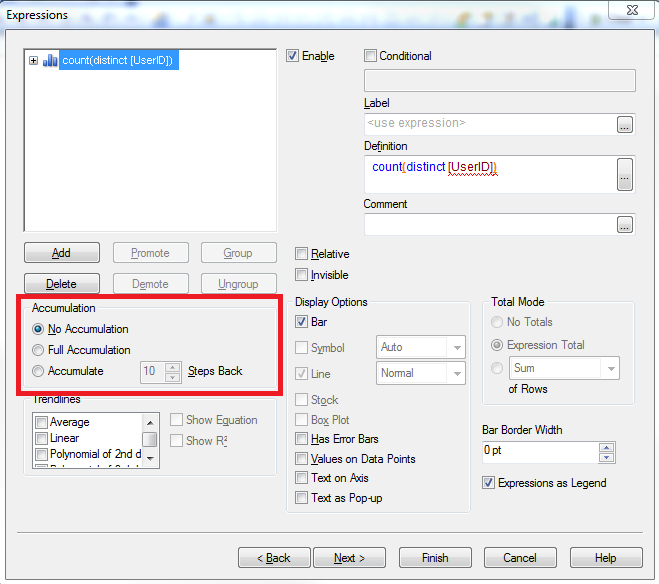
You should be able to do this by using the Accumulation feature that QlikView has built into charts. You can use Full Accumulation to accumulate over all time, or you can use the # Steps Back method to only go back to a certain point in time (i.e 12 for going back a year):
- Mark as New
- Bookmark
- Subscribe
- Mute
- Subscribe to RSS Feed
- Permalink
- Report Inappropriate Content
Based on the initial expaination, I would have responded the same. Unfortunately, it is more complicated than that. I will not be looking at the ID as a dimension. I will have to perform a logic comparison on the accumulated amoun and provide a count based on a upper and lower threshold. My issue is the inline transformation of data.

- Mark as New
- Bookmark
- Subscribe
- Mute
- Subscribe to RSS Feed
- Permalink
- Report Inappropriate Content
See attached example
talk is cheap, supply exceeds demand