Unlock a world of possibilities! Login now and discover the exclusive benefits awaiting you.
This space offers a variety of blogs, all written by Qlik employees. Product and non product related.
Product Innovation
By reading the Product Innovation blog, you will learn about what's new across all of the products in our growing Qlik product portfolio.
Support Updates
The Support Updates blog delivers important and useful Qlik Support information about end-of-product support, new service releases, and general support topics.
Qlik Academic Program
This blog was created for professors and students using Qlik within academia.
Community News
Hear it from your Community Managers! The Community News blog provides updates about the Qlik Community Platform and other news and important announcements.
Qlik Digest
The Qlik Digest is your essential monthly low-down of the need-to-know product updates, events, and resources from Qlik.
Qlik Education
The Qlik Education blog provides information about the latest updates of our courses and programs with the Qlik Education team.
Recent Blog Posts
-
Qlik Introduces a New Era of Visualization
"A picture is worth a thousand words, but a visualization can tell a million stories." -
Silent Auth using qlik-embed and OAuth
On a previous blog post, we took a look at qlik-embed, Qlik’s newest embedding framework and saw how easy it is to get started using it to integrate content from Qlik directly in your web applications. Today, we will see how to integrate qlik-embed UIs in your web applications that are connected to an OIDC-compliant IDP silently, without prompting users for authorization. Before we get started, consider the following pre-requisites: 1- IDP: We n... Show MoreOn a previous blog post, we took a look at qlik-embed, Qlik’s newest embedding framework and saw how easy it is to get started using it to integrate content from Qlik directly in your web applications.
Today, we will see how to integrate qlik-embed UIs in your web applications that are connected to an OIDC-compliant IDP silently, without prompting users for authorization.
Before we get started, consider the following pre-requisites:
1- IDP:
- We need an IDP, in this blog post, I will use Auth0 which offers a Free starter plan that you can use to test out this functionality.
2- Qlik Cloud Tenant:
- We will configure the Qlik Cloud tenant with both the IDP provider and an OAuth Client.
3- Web App
- Our Web App will be served using Node.js, so make sure to have the latest node.js version installed
Step 1- Auth0 IDP Configuration
After creating an account on Auth0, create an Application and select “Single Page Web Application” as the application type.
Next,, navigate to Settings and take node of the following:
- Domain
- Client ID
- Client Secret
- OpenID Configuration URL (you will find this after you expand Advanced Settings under Endpoints)
We will need these values later on in the post.
In the allowed Callback URLs field, add the following URL:
https://{YOUR TENANT DOMAIN}.us.qlikcloud.com/login/callback
In Allowed Web Origins, add the following URL:
Step 2- Qlik Cloud Tenant Configuration
In this step, we will do 2 things, first, we will create and configure an identity provider. Second, we will configure an OAuth client.
2.1- Identity Provider:
- Navigate to your Management Console > Identity Provider > Create New
- Choose OIDC as the type
- Choose Auth0 as the Provider
- Enter the OpenID Configuration URL from Step 1
- Enter the Client ID and Client Secret from Step 1
- Expand Advanced Options and turn ON Email Verified Override
- You can now Save and then Validate the IDP configuration, this will prompt you to authenticate to Auth0 (make sure you have an active user).
2.1- Configure the OAuth Client:
-
Navigate to the Management Console > OAuth > Click on Create new
-
Select Single-page app as the Client type
-
Select user_default for scope
-
Add the following as your Redirect URL
-
Add the following in the allowed origins:
- Once your Save, Copy the Client ID
We will need it in the next step.
Step 3- Creating the Web Application
3.1- Server: We will use Express to spin up a small server and use the “express-openid-connect” as a middleware to configure Auth0 and require authentication when a user tried to access resources without being authenticated.
It will redirect the user to log in and then back to the site once successfully authenticated.
- the .env file should contain your Environment variables with the following:
- HOST → localhost:3000
- clientId → the client ID from Auth0 from step1
- clientSecret → the client secret from Auth0 from step1
- idpUri → the Domain from Auth0 from step1
- sessionSecret → A random string
- tenantUri → Qlik Cloud tenant
- redirectPage → oauth-callback.html
3.2- Frontend
- index.html: In the public folder, the index.html contains the setup for qlik-embed. In the script tag, the following values need to be entered:
- data-host: Qlik Cloud tenant
- data-client-id: The OAuth client Id from Step 2.2
- data-auto-redirect: set to True, this will remove the Authorize button that appears on qlik-embed UIs. It will silently redirect to Qlik Cloud if the user is authenticated.
- oauth-callback.html
This file contains a script tag with a qlik-embed callback. Make sure to set up data-host to your Qlik Cloud tenant url.
The entire source code can be found in the following Github Repo:
https://github.com/ouadie-limouni/silent-auth-qlik-embedRun the project:
First, you will need to generate a self signed certificate to put in the certs folder so we can be able to open localhost as https.
You can do this using openssl by following the directions below:
1- run the following command:
openssl genrsa -out cert.key 20482- then run and hit enter on all the prompts:
openssl req -new -key cert.key -out cert.csr3- then run:
openssl x509 -req -days 3650 -in cert.csr -signkey cert.key -out cert.crtyou will generate a cert.crt and cert.key files that you should put in the certs folder.
To compile and run the project:
- run: npm install
- then run: node index.js
Once you open https://localhost:3000, you will be automatically redirected to the Auth0 page.
After successfully authenticating in Auth0, you will be redirected to the web app and the qlik-embed UI will render the Qlik Sense app.
I hope you found this post helpful, for a more in depth tutorial and more, visit https://qlik.dev/embed/qlik-embed/
-
Football_app
Football_appHapag-LloydI did this app not for work obviously. It shows some football stats, but with focus on how the fact if game was played on home stadium or away impacted the statistics(like goals, shots, ball possession etc)DiscoveriesIf team plays game at home, they score more, and win the games more oftenImpactIt didn't, I did it just for myself 🙂AudienceI showed it just to my Professor at my Business Informatics studies and my colleagues... Show MoreFootball_appHapag-Lloyd I did this app not for work obviously. It shows some football stats, but with focus on how the fact if game was played on home stadium or away impacted the statistics(like goals, shots, ball possession etc)
Discoveries
If team plays game at home, they score more, and win the games more often
Impact
It didn't, I did it just for myself 🙂
Audience
I showed it just to my Professor at my Business Informatics studies and my colleagues from the group. They liked it.
Data and advanced analytics
I used alternate states for it, to enable on one side of the dashboard to select games played at home, and on the second side games played away.
-
QlikView - New Security Patches Available Now
Update 21st of March 16:00 CET: published CVE numberUpdate 27th of March 10:45 CET: added FAQ Hello Qlik Users, A security issue in QlikView has been identified and patches have been made available. Details can be found in the Security Bulletin High Severity Security fix for QlikView (CVE-2024-29863). Today, 20th of March 2024, we have released two service releases across the latest versions of QlikView to patch the reported issue. All versions o... Show MoreUpdate 21st of March 16:00 CET: published CVE number
Update 27th of March 10:45 CET: added FAQHello Qlik Users,
A security issue in QlikView has been identified and patches have been made available. Details can be found in the Security Bulletin High Severity Security fix for QlikView (CVE-2024-29863).
Today, 20th of March 2024, we have released two service releases across the latest versions of QlikView to patch the reported issue. All versions of QlikView prior to and including the releases below are impacted:
- QlikView May 2023 SR1 (12.80.20100)
- QlikView May 2022 SR2 (12.70.20200)
Call to Action
As no workarounds can be provided, Customers should upgrade QlikView to one of the following versions that contain the fix:
- QlikView May 2023 SR2 (12.80.20200)
- QlikView May 2022 SR3 (12.70.20300)
This issue only impacts QlikView. Other Qlik data analytics products including Qlik Cloud and Qlik Sense Enterprise on Windows are not impacted.
Additional Details
- All Qlik software can be downloaded from our official Qlik Download page (customer login required). Follow best practices when upgrading QlikView.
- Qlik provides patches for major releases until the next Initial or Service Release is generally available. See Release Management Policy for Qlik Software.
- Notwithstanding, additional patches for earlier releases may be made available at Qlik’s discretion.
- The information in this post and Security Bulletin High Severity Security fix for QlikView (CVE-2024-29863) is disclosed in accordance with our published Security and Vulnerability Policy.
The Security Notice label is used to notify customers about security patches and upgrades that require a customer’s action. Please subscribe to the ‘Security Notice’ label to be notified of future updates.Frequently Asked Questions
Q: Is the vulnerability present in the QlikView Plugin or other QlikView products?
A: The vulnerability is related to the MSI files on disk.Q: Will deleting the MSI files mitigate the issue?
A: Qlik does not consider removing the MSI files a complete workaround. A server user can restore them. -
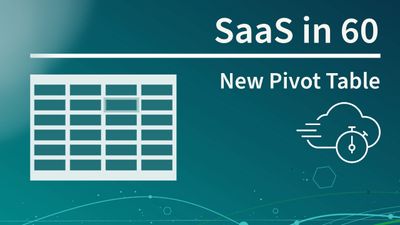
Checkout the New Pivot Table!
Unlock the power of data with our new, redesigned Pivot Table available in the Visualization Bundle.
-
The As-Of Table
Last week I wrote about how the Above() function can be used for calculating rolling averages and other accumulations. There is however also an alternative method for doing the same thing:The As-Of table.When you use the Above() function, you fetch a number from other rows in a chart or Aggr() table. The As-Of table is slightly different in this respect: It is not a transient table created by an object or an expression – instead it is a real tabl... Show MoreLast week I wrote about how the Above() function can be used for calculating rolling averages and other accumulations. There is however also an alternative method for doing the same thing:
The As-Of table.
When you use the Above() function, you fetch a number from other rows in a chart or Aggr() table. The As-Of table is slightly different in this respect: It is not a transient table created by an object or an expression – instead it is a real table in the data model.
The idea is to create a secondary month field – the AsOfMonth - that links to multiple real months.
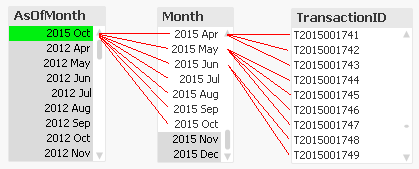
In the example above, you can see that ‘2015 Oct’ links to several preceding months, and each Month in turn links to several rows in a fact table. This means that a specific transaction will be linked to several AsOfMonths.
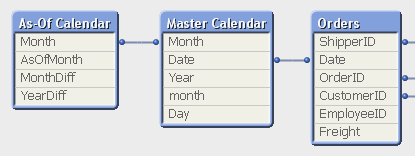
In the data model, the As-Of table should appear as a separate calendar table that links to the existing primary calendar table:
One way to create this table is the following:
First, make sure that you in your master calendar have a field “Month” that is defined as the first date of the month, e.g.
Date(MonthStart(Date),'YYYY MMM') as Month,
Then add the following lines at the end of the script:
// ======== Create a list of distinct Months ========
tmpAsOfCalendar:
Load distinct Month
Resident [Master Calendar] ;// ======== Cartesian product with itself ========
Join (tmpAsOfCalendar)
Load Month as AsOfMonth
Resident tmpAsOfCalendar ;// ======== Reload, filter and calculate additional fields ========
[As-Of Calendar]:
Load Month,
AsOfMonth,
Round((AsOfMonth-Month)*12/365.2425) as MonthDiff,
Year(AsOfMonth)-Year(Month) as YearDiff
Resident tmpAsOfCalendar
Where AsOfMonth >= Month;Drop Table tmpAsOfCalendar;
Once this table has been created, you can use the AsOfMonth as dimension in charts where you want rolling averages and accumulations.
If you as measure use
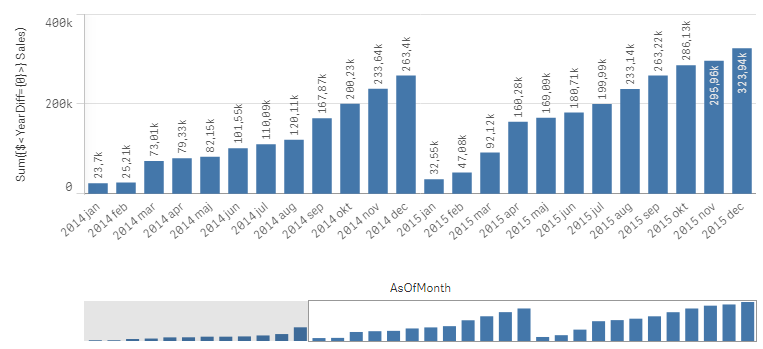
Sum({$<YearDiff={0}>} Sales)
you will get a yearly accumulation – year-to-date up until the day of the script run.
If you instead use
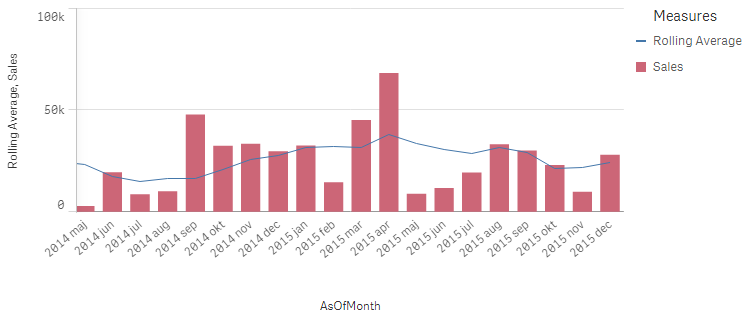
Sum({$<MonthDiff={"<6"}>} Sales) / Count(distinct {$<MonthDiff={"<6"}>} Month)
you will get a 6-month rolling average:
And finally, if you use
Sum({$<MonthDiff={0}>} Sales)
You will get the real, non-accumulated numbers.
I have made the Set Analysis expressions based on two fields: YearDiff and MonthDiff. However, for clarity it could be a good idea to add flags in the As-Of table, so that the Set Analysis expressions become even simpler, e.g.
If(MonthDiff=0,1,0) as IsSameMonth,
If(YearDiff=0,1,0) as IsSameYear,
If(MonthDiff<6,1,0) as IsRolling6,Summary: The As-Of table is a good way to calculate rolling averages and accumulations.
Further reading related to this topic:
Calculating rolling n-period totals, averages or other aggregations

-
Techspert Talks - Exploring Qlik Cloud Data Integration
Hi everyone, Want to stay a step ahead of important Qlik support issues? Then sign up for our monthly webinar series where you can get first-hand insights from Qlik experts. Next Thursday, May 16th Qlik will host another Techspert Talks session and this time we are looking at Exploring Qlik Cloud Data Integration. But wait, what is it exactly?Techspert Talks is a free webinar held on a monthly basis, where you can hear directly from Qlik Techsp... Show MoreHi everyone,
Want to stay a step ahead of important Qlik support issues? Then sign up for our monthly webinar series where you can get first-hand insights from Qlik experts.Next Thursday, May 16th Qlik will host another Techspert Talks session and this time we are looking at Exploring Qlik Cloud Data Integration.
But wait, what is it exactly?
Techspert Talks is a free webinar held on a monthly basis, where you can hear directly from Qlik Techsperts on topics that are relevant to Customers and Partners today.In this session, we will cover:
- What it can do
- How it can be used
- Cloud Data Architecture
Click on this link to choose the webinar time that's best for you
The webinar is hosted using ON24 in English and will last 30 minutes plus time for Q&A.
Hope to see you there!!
-
Anglia Ruskin University students boost employability skills with Qlik Academic ...
Check out our new success story about our collaboration with Anglia Ruskin University. -
Qlik Sense Migration: Migrating your Entire Qlik Sense Environment
Hi everyone, For various and valid reasons, you might need to migrate your entire Qlik Sense environment, or part of it, somewhere else. In this post, I’ll cover the most common scenario: a complete migration of a single or multi-node Qlik Sense system, with the bundled PostgreSQL database (Qlik Sense Repository Database service) in a new environment. So, how do we do that? Introduction and preparationBackup your old environmentDeploy and rest... Show MoreHi everyone,
For various and valid reasons, you might need to migrate your entire Qlik Sense environment, or part of it, somewhere else.
In this post, I’ll cover the most common scenario: a complete migration of a single or multi-node Qlik Sense system, with the bundled PostgreSQL database (Qlik Sense Repository Database service) in a new environment.
So, how do we do that?
- Introduction and preparation
- Backup your old environment
- Deploy and restore the new central environment
- What about my rim nodes?
- Finalizing your migration
- Data Connection
- Licensing
- Best practices
Introduction and preparation
Let’s start with a little bit of context: Say that we are running a 3 nodes Qlik Sense environment (Central node / Proxy-Engine node / Scheduler node).
On the central node, I also have the Qlik shared folder and the bundled Qlik Sense Repository Database installed.
This environment has been running well for years but I now need to move it to a brand new hardware ensuring better performance. It’s not possible to reinstall everything from scratch because the system has been heavily used and customized already. Redoing all of that to replicate the environment is too difficult and time-consuming.
I start off with going through a checklist to verify if the new system I’m migrating to is up to it:
- Do I meet the system requirements? Qlik Sense System Requirements
- What about the hardware? List of Favorable Server Hardware from Qlik Scalability Center
- Am I following virtualization best practices? Virtualization Best Practices In QlikView And Qlik Sense
And then I move right over to…
Backup your old environment
The first step to migrate your environment in this scenario is to back it up.
To do that, I would recommend following the steps documented on help.qlik.com (make sure to select your Qlik Sense version top left of the screen).
Once the backup is done you should have:
- A backup of the database in .tar format
- A backup of the content of the file share which includes your applications, application content, archived logs, extensions,…
- Backups of any data source files that need to be migrated and are not stored in the shared folder like QVDs
Then we can go ahead and…
Deploy and restore the new central environment
The next steps are to deploy and restore your central node. In this scenario, we will also assume that the new central node will have a different name than the original one (just to make things a bit more complicated 😊).
Let’s start by installing Qlik Sense on the central node. That’s as straightforward as any other fresh install.
You can follow our documentation. Before clicking on Install simply uncheck the box “Start the Qlik Sense services when the setup is complete.”
The version of Qlik Sense you are going to install MUST be the same as the one the backup is taken on.
Now that Qlik Sense is deployed you can restore the backup you have taken earlier into your new Qlik Sense central node following Restoring a Qlik Sense site.
Since the central node server name has also changed, you need to run a Bootstrap command to update Qlik Sense with the new server name. Instruction provided in Restoring a Qlik Sense site to a machine with a different hostname.
The central node is now almost ready to start.
If you have changed the Qlik Share location, then the UNC path has also changed and needs to be updated.
To do that:
- Go to C:\Program Files\Qlik\Sense\Repository\Util\QlikSenseUtil
- Run QlikSenseUtil.exe as Administrator
- Click on Connect to the database and enter the credential to connect to the new PostgreSQL database
- Click on Service Cluster and press OK. This should display the previously configured UNC Path
- You simply need to update each path, save and start/restart all the Qlik sense services.
At this point make sure you can access the Qlik Sense QMC and Hub on the central node. Eventually, check that you can load applications (using the central node engine of course). You can also check in the QMC > Service Cluster that the changes you previously made have been correctly applied.
Troubleshooting tips: If after starting the Qlik Sense services, you cannot access the QMC and/or Hub please check the following knowledge article How to troubleshoot issue to access QMC and HUB
What about my rim nodes?
You’ve made it here?! Then congratulation you have passed the most difficult part.
If you had already running and configured rim nodes in your environment that you now need to migrate as well, you might not want to remove them from Qlik Sense to add the new ones since you will lose pretty much all the configuration you have done so far on these rim nodes.
By applying the following few steps I will show you how to connect to your “new” rim node(s) and keep the configuration of the “old” one(s).
Let’s start by installing Qlik Sense on each rim node like it was a new one.
The process is pretty much the same as installing a central node except that instead of choosing “Create Cluster”, you need to select “Join Cluster”
Detailed instruction can be found on help.qlik.com: Installing Qlik Sense in a multi-node site
Once Qlik Sense is installed on your future rim node(s) and the services are started, we will need to connect to the “new” Qlik Sense Repository Database and change the hostname of the “old” rim node(s) to the “new” one so that the central node can communicate with it.
To do that install PGAdmin4 and connect to the Qlik Sense Repository Database. Detailed instruction in Installing and Configuring PGAdmin 4 to access the PostgreSQL database used by Qlik Sense or NPrinting knowledge article.
Once connected navigate to Databases > QSR > Schemas > public > Tables
You need to edit the LocalConfigs and ServerNodeConfigurations table and change the Hostname of your rim node(s) from the old one to the new corresponding one (Don’t forget to Save the change)
LocalConfigs table
ServerNodeConfigurations table
Once this is done, you will need to restart all the services on the central node.
When you have access back, login to the QMC and go to Nodes. Your rim node(s) should display the following status, “The certificate has not been installed”
From this point, you can simply select the node, click on Redistribute and follow the instruction to deploy the certificates on your rim node. After a moment the status should change and you should see the services being up and running.
Do the same thing on the remaining rim node(s).
Troubleshooting tips: If the rim node status is not showing “The certificate has not been installed” it means that either the central node cannot reach the rim node or the rim node is not ready to receive new certificates.
Check that the port 4444 is opened between the central and rim node and make sure the rim node is listening on port 4444 (netstat -aon in command prompt).
Still no luck? You can completely uninstall Qlik Sense on the rim node and reinstall it.Finalizing your migration
At this point, your environment is completely migrated and most of the stuff should work.
Data Connection
There is one thing to consider in this scenario. Since the Qlik Sense certificates between the old environment and the new one are not the same, it is likely that data connections with passwords will fail. This is because passwords are saved in the repository database with encryption. That encryption is based on a hash from the certs. When the Qlik Sense self-signed cert is rebuilt, this hash is no longer valid, and so the saved data connection passwords will fail. You will need to re-enter the passwords in each data connection and save. This can be done in the QMC -> Data Connections.
See knowledge article: Repository System Log Shows Error "Not possible to decrypt encrypted string in database"
Licensing
Do not forget to turn off your old Qlik Sense Environment. As per your license agreement, you can only use one license per active Qlik Sense environment. Reach out to your account manager for more details.
Best practices
Finally, don’t forget to apply best practices in your new environment:
- Qlik Sense Folder And Files To Exclude From AntiVirus Scanning
- Recommended practice on configuration for Qlik Sense
-
2022 FIFA World Cup Teams
2022 FIFA World Cup Teams AnyChart — QS Extensions Explore Qatar 2022 teams by league and club with remarkable Decomposition Trees. Discoveries Investigate how the national football/soccer teams of all 32 participating countries in the 2022 Qatar World Cup are made up of players from various leagues and clubs, using remarkable Decomposition Tree visualizations in Qlik Sense. (Re)arrange the order of the represented dimensions dependin... Show More2022 FIFA World Cup TeamsAnyChart — QS ExtensionsExplore Qatar 2022 teams by league and club with remarkable Decomposition Trees.Discoveries
Investigate how the national football/soccer teams of all 32 participating countries in the 2022 Qatar World Cup are made up of players from various leagues and clubs, using remarkable Decomposition Tree visualizations in Qlik Sense. (Re)arrange the order of the represented dimensions depending on how you want to disaggregate the totals. Analyze goals and caps for national teams similarly using intuitive decomposition trees.
Impact
Check out how AnyChart's Decomposition Tree works and how it can help you explore data across multiple dimensions.
Audience
Anyone who wants to analyze the 2022 Qatar World Cup's teams and see an example of a decomposition tree in Qlik Sense in action.
Data and advanced analytics
This application features decomposition trees built with AnyChart's Decomposition Tree extension for Qlik Sense.
🔗 >> VIEW IT LIVE OR DOWNLOAD (.QVF) <<
-
Complete your Qlik Nation challenges in Qlik Community
Introducing an easy way for you to engage, earn points and rank up. -
Will we see you at Qlik Connect? (+ May enhancements)
Read more for the May enhancements in Qlik Community. -
Qlik Cloud: Introducing OAuth2 authentication for the Microsoft 365 email provid...
As of May 7, 2024, Qlik has released an often-requested feature: the ability to set up your Microsoft Office 365 email provider with OAuth 2.0 authentication, ensuring secure communication between Qlik Cloud and Microsoft Office 365. How to get started The setup is simple. If your IT wishes to use Microsoft Office 365 as your email provider for Qlik Cloud, see Configuring a Microsoft 365 email provider using OAuth2. What to be aware of Before... Show MoreAs of May 7, 2024, Qlik has released an often-requested feature: the ability to set up your Microsoft Office 365 email provider with OAuth 2.0 authentication, ensuring secure communication between Qlik Cloud and Microsoft Office 365.
How to get started
The setup is simple. If your IT wishes to use Microsoft Office 365 as your email provider for Qlik Cloud, see Configuring a Microsoft 365 email provider using OAuth2.
What to be aware of
Before using the Microsoft 365 service connection, please familiarize yourself with Microsoft’s terms of use for a single mailbox as per Limits per app ID and mailbox combination and Storage limits across standalone plans (learn.microsoft.com).
Keep Microsoft's API limits in mind before choosing your email provider. This includes requests per minute, concurrent requests, and size restrictions. Example: a capability such as Tabular Reporting can create large files as part of its reporting job creation, which may exceed Microsoft's service limits.
See Qlik Cloud: Sending email with Microsoft 365 fails for details.
Don't hesitate to reach out if you have any questions. We always look forward to your feedback.
Thank you for choosing Qlik,
Qlik Support -
Talend Data Fabric - Upgrade Notification, Java 17 compatibility for Talend 8 R2...
To our Talend 8 Customers, To enhance both your security and Talend experience, Java 17 will be the only supported Java version for future updates to Talend Studio and the following supported applications. Talend Studio Talend Administration Center Talend Data Preparation - (client managed installation) Talend Data Stewardship - (client managed installation) Talend SAP RFC Server Talend Semantic Dictionary Talend Identity and Access Management ... Show MoreTo our Talend 8 Customers,
To enhance both your security and Talend experience, Java 17 will be the only supported Java version for future updates to Talend Studio and the following supported applications.
- Talend Studio
- Talend Administration Center
- Talend Data Preparation - (client managed installation)
- Talend Data Stewardship - (client managed installation)
- Talend SAP RFC Server
- Talend Semantic Dictionary
- Talend Identity and Access Management
Note: this upgrade does not impact execution of your artifacts that continue to support Java 8 or 11.
Previous versions of Java will no longer be supported by the above application when electing to upgrade to R2024-05. We are giving you this advanced notice to ensure you can plan this upgrade and take time to review your current Java environment. Java 17 support was first introduced with the R2023-10 release.
By giving this advanced notification, we are delighted to be able to reach a point of maturity where we can fully support best practices with dependencies and third-party libraries and be proactive in addressing CVEs to deliver constant improvement to the Talend Studio platform.
Compatibility Documentation:
For further questions please contact Qlik Talend Support and subscribe to the Support Blog for future updates.
Thank you for choosing Qlik,
Qlik Talend Customer Success
-
生成AI どう使う?ChatGPTの機能と限界と活用事例~ChatGPTは歯科医師国家試験に合格するのか?~
5月21日の無料Webセミナーのご案内です。今回は、いつもの TechTalk と違って、Qlik の長年のユーザーである九州歯科大学の守下准教授をお招きします。守下先生は、電子カルテシステムの運営・管理を手掛け、電子カルテ・医事会計システムなどの医療情報データを Qlik Senseで分析し、病院経営に貢献されています。また学生の成績データをQlik Senseを通じて分析し、Institutional Research 活動も展開されています。 当日はインタビュー形式で、生成AIの進化と機能、実用例についてお話をお伺いする予定です。Qlik と組み合わせた使用方法についてもお伺いしたいと思っています。 守下先生は、これまでに大学経営、教育、病院運営にデータを活用する試みを多く取り組まれてきましたが、特に最近の注目すべき点として、ChatGPTがどのようにして歯科医師国家試験に回答したか、その結果と教育現場への応用可能性に焦点を当て、実践的な課題と洞察も共有いたします。 是非... Show More5月21日の無料Webセミナーのご案内です。
今回は、いつもの TechTalk と違って、Qlik の長年のユーザーである九州歯科大学の守下准教授をお招きします。守下先生は、電子カルテシステムの運営・管理を手掛け、電子カルテ・医事会計システムなどの医療情報データを Qlik Senseで分析し、病院経営に貢献されています。また学生の成績データをQlik Senseを通じて分析し、Institutional Research 活動も展開されています。当日はインタビュー形式で、生成AIの進化と機能、実用例についてお話をお伺いする予定です。Qlik と組み合わせた使用方法についてもお伺いしたいと思っています。
守下先生は、これまでに大学経営、教育、病院運営にデータを活用する試みを多く取り組まれてきましたが、特に最近の注目すべき点として、ChatGPTがどのようにして歯科医師国家試験に回答したか、その結果と教育現場への応用可能性に焦点を当て、実践的な課題と洞察も共有いたします。
是非みなさまご参加ください。
お申し込みはこちら

-
Get ready...the new Qlik Learning is coming soon!
A single, integrated learning platform with all the training you're looking for. Get hands on experience, expertise and certified all in one place.
-
Introducing Qlik Cloud Tabular Reporting
We are excited to introduce tabular reporting from Qlik Cloud. Now customers can address common, centrally managed, tabular report distribution requirements from within a Qlik Sense Application! With tabular reporting, report developers can create custom and highly formatted XLS documents from Qlik data and Qlik visualizations; Governed Report Tasks can burst reports to any stakeholder, ensuring that the Qlik platform is the source for operationa... Show MoreWe are excited to introduce tabular reporting from Qlik Cloud. Now customers can address common, centrally managed, tabular report distribution requirements from within a Qlik Sense Application! With tabular reporting, report developers can create custom and highly formatted XLS documents from Qlik data and Qlik visualizations; Governed Report Tasks can burst reports to any stakeholder, ensuring that the Qlik platform is the source for operational decisions, customer communications and more.
Some feature highlights:
- Report template creation, using data and visualizations from a Qlik Sense App, all with the familiarity of Microsoft Office 365 using Add-in technology
- Qlik Cloud governed report task control from within a Qlik Sense App
- In app distribution list management to support burst report distribution to any stakeholder (internal or external)
- Execution of Qlik NPrinting authored XLS report templates uploaded to Qlik Cloud
- Powered by the Qlik Reporting Service, reports are delivered from a scalable cloud service that solves complex enterprise reporting jobs
Want to get started with your first Tabular Report?
Access our Getting Started section in your Qlik Cloud app (available for users with Can Edit permissions). Open your app, (a) choose your activity, and select (b) Reporting.
From here, you can begin with our introductory videos and configuration instructions:
Want to know more about Qlik’s Tabular Reporting feature?
- See the Tabular Reporting introductory videos
- To get started see Tabular reporting in Qlik Cloud Analytics
- To access and discuss the Qlik NPrinting Technical Preview, go to Qlik's Technical Previews
- The Qlik Excel add-in can be deployed and installed for compatible web and desktop versions of Microsoft Excel within Microsoft 365 see Deploying and installing the Qlik add-in for Microsoft Excel and speak with your Office 365 administrator if you wish to deploy the capability
- Generating tabular reports in Qlik Cloud Analytics is a value-add Qlik Reporting Service capability. Check with your service account owner about your Qlik Cloud subscription's included capacities. Please be aware that overage will be monitored and capped starting in 2024.
- Adopting customers should familiarize themselves with guardrails and limits see Qlik Reporting Service specifications and limitation
Thank you for choosing Qlik,
Qlik Support -
Straight Table
The straight table, included in the Visualization bundle, has all the table properties that we are used to as well as many new features. These new features make it easier for developers to create a straight table and it gives users the ability to customize straight tables in the apps they view. The straight table is ideal when you want to provide detailed data – the raw data. While you do not want to have too many columns (ten or less columns are... Show MoreThe straight table, included in the Visualization bundle, has all the table properties that we are used to as well as many new features. These new features make it easier for developers to create a straight table and it gives users the ability to customize straight tables in the apps they view. The straight table is ideal when you want to provide detailed data – the raw data. While you do not want to have too many columns (ten or less columns are ideal for the best performance), a straight table can have many columns (dimensions and measures).
As previously mentioned, the straight table can be added to a sheet from the Qlik Visualization bundle. This means developers will need to open the advanced options to add the straight table to their sheet(s) and make edits. Once the straight table is added to a sheet, developers can add columns – either fields and master items or custom expressions. One of the new features that developers can take advantage of to build tables quickly is the ability to add more than one dimension and/or measure at once. Simply select the dimensions and measures you would like to add to the table and then click the Add button.
Once columns are added to the table, they can be dragged as needed to the desired position/order. Developers also can add alternate columns to the straight table. These columns can be dimensions and/or measures. These alternates columns will be available to users to customize the straight table if chart exploration is enabled. This is a great new feature because the user does not need edit permissions to modify the straight table. Users can add and/or remove columns based on their analysis. Being able to add columns as needed also improves performance since the straight table does not need to display all the columns, all the time. Loading the straight table with the minimum columns needed will decrease the load time.
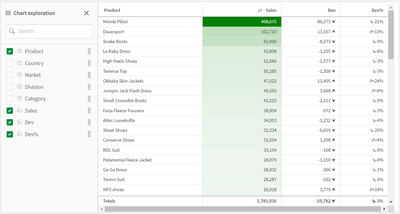
Chart exploration allows users, who are in analysis mode, to add and remove columns from the straight table they are viewing by checking or unchecking them in the Chart exploration panel (see image below). Any users viewing the sheet can customize the straight table. Users cannot see layout changes made by other users using the app, unless they opt to share the visualization or create a public bookmark with the layout saved.
Another new feature for developers is the ability to set the column width. By default, the column width is set to Auto, but developers can set it to Fix to content, Pixels or Percentage. Pagination is another new feature that can be enabled in a Straight table. With pagination, a specified number of rows are displayed at once and the user can navigate through the pages using arrows or selecting the page.
Many of the properties for the straight table are familiar but the new ones are moving the straight table to a new level. Learn everything you need to know about the straight table in Qlik Help and add one to your next app. Also check out the SaaS in 60 video for a quick video overview:
Thanks,
Jennell
-
Qlik Cloud Scheduled Maintenance May 11 / May 12 By Region
For continuous improvement to our Qlik Cloud platform, planned maintenance has been scheduled for next weekend, May 11th/12th. The maintenance windows will occur per region, during nonpeak hours and are expected to last 30 minutes. During these maintenance windows, customers will not have access to Qlik Cloud Tenants. Full access to Qlik Cloud will resume following the end of each region’s maintenance window. For Qlik Cloud tenants hosted in ... Show MoreFor continuous improvement to our Qlik Cloud platform, planned maintenance has been scheduled for next weekend, May 11th/12th. The maintenance windows will occur per region, during nonpeak hours and are expected to last 30 minutes.
During these maintenance windows, customers will not have access to Qlik Cloud Tenants. Full access to Qlik Cloud will resume following the end of each region’s maintenance window.
- For Qlik Cloud tenants hosted in the Sydney region:
- Planned maintenance is scheduled to start May 12, 2024 at 12:00 AM AEST and last approximately 30 minutes.
- For Qlik Cloud tenants hosted in the Singapore region:
- Planned maintenance is scheduled to start May 11, 2024 at 10:30 PM SST and last approximately 30 minutes.
- For Qlik Cloud tenants hosted in the Japan region:
- Planned maintenance is scheduled to start May 12, 2024 at 12:00 AM JST and last approximately 30 minutes.
- For Qlik Cloud tenants hosted in the UK region:
- Planned maintenance is scheduled to start May 11, 2024 at 04:30 PM BST and last approximately 30 minutes.
- For Qlik Cloud tenants hosted in the Europe region:
- Planned maintenance is scheduled to start May 11, 2024 at 06:00 PM CEST and last approximately 30 minutes.
- For Qlik Cloud tenants hosted in the DE region:
- Planned maintenance is scheduled to start May 11, 2024 at 06:30 PM CEST and last approximately 30 minutes.
- For Qlik Cloud tenants hosted in the Americas region:
- Planned maintenance is scheduled to start May 11, 2024 at 01:00 PM EDT and last approximately 30 minutes.
To track further updates during the scheduled Qlik Cloud Maintenance, please visit our Qlik Cloud Status page.
Thank you for choosing Qlik!
Qlik Global Support
- For Qlik Cloud tenants hosted in the Sydney region:
-
New Helpful Features
In this blog post, I will cover four Qlik Cloud features that you may not be aware of, but I find to be useful. They are: New navigation option for buttons. The ability to change the opacity of a background color. The ability to add links to straight and pivot tables. Placement of sheet navigation buttons with hidden sheet header. The first feature is the option to navigate to a specific chart using button actions and navigation. We have always... Show MoreIn this blog post, I will cover four Qlik Cloud features that you may not be aware of, but I find to be useful. They are:
- New navigation option for buttons.
- The ability to change the opacity of a background color.
- The ability to add links to straight and pivot tables.
- Placement of sheet navigation buttons with hidden sheet header.
The first feature is the option to navigate to a specific chart using button actions and navigation. We have always had the ability to navigate to a specified sheet but now, we can select a chart to highlight. In the Sales Analysis sheet below, there is a View Sales Details button on the bottom left that is used to navigate the user to the Details sheet and highlight the Sales Details table.
To implement this, the actions and navigation properties of the button need to be set to the Details sheet and the chart ID for the Details table, as seen below.
The Chart ID drop down will show all the IDs for charts on the selected sheet. (In this case, the Details sheet). To ensure you are selecting the correct chart, you can check or copy the chart ID by right clicking on the chart, clicking on …, selecting Share from the menu, then selecting Embed from the menu. These steps are illustrated below.
The Embed dialog window below will open and beneath the chart is its object ID. You can copy the object ID and paste it in the properties window for the button or note it and select it from the chart ID drop down list.
In this example, I used the “go to chart” to navigate between sheets but it can also be used on a single sheet. Now, when the user clicks on the View Sales Details button, they are navigated to the Details sheet and the Sales Details table, at the top of the sheet, is highlighted. Notice the blue colored box around it.
The second new feature is the ability to change the opacity of the background color. In the chart below, I have added a background color in the styling properties of the chart. After I select a color for the background, I can use the slider to adjust the opacity, if I choose. In this example, I set it to 60%. By default, it will set to 100% opacity.
The third new feature is the ability to add links to straight tables and pivot tables. Both tables are found in the Visualization bundle.
To add the link is easy. In the properties of the column (see image below), the Field should be the URL you would like for the link. In this example, the link is hard-coded, but you can also use a field value or expression to generate the link. The key to this working is setting Representation to Link (versus Text, which is the default).
The fourth, and last, new feature that I am going to cover in this blog is the new placement of the sheet navigation arrows when the sheet header is hidden. In a previous blog, I discussed how to toggle the sheet header and sheet toolbar. The sheet navigation arrows are in the sheet header as seen below and in the past when the sheet header was hidden, the navigation arrows were not available.
Now, when the sheet header is hidden, the sheet navigation arrows are moved up to the sheet toolbar. A small change, but quite helpful.
Now if you opt to hide the sheet toolbar as well, you may want to consider adding navigation to your sheet.
To wrap it up, this blog covers some small new features that you may find helpful. Users can now navigate to a visualization via button actions, the styling properties have been improved with the ability to set the opacity for a background color, URL links are available in straight and pivot tables and sheet navigation has become a little more flexible. Check out these new features next time you are developing an app.
Thanks,
Jennell