Unlock a world of possibilities! Login now and discover the exclusive benefits awaiting you.

- Qlik Community
- :
- Forums
- :
- Archive
- :
- Archived Groups
- :
- Re: Line Chart AOP
- Subscribe to RSS Feed
- Mark Topic as New
- Mark Topic as Read
- Float this Topic for Current User
- Bookmark
- Subscribe
- Mute
- Printer Friendly Page

 jood_ahmad
- Mark as New
- Bookmark
- Subscribe
- Mute
- Subscribe to RSS Feed
- Permalink
- Report Inappropriate Content
Line Chart AOP
Dears,
it is possible to build in line chart two expression and pretense it on the same dimension like:
i need to build the AOP (Sales / Orders) on Day dimension and i need on the same chart compare this AOP for each day with the previous day as long the month; so i will have for 1 month 2 line the first line for the current AOP and the second line for the AOP -1Day.
Message was edited by: Ahmad Kastero
Message was edited by: Ahmad Kastero THE LAST UPDATE WITHOUT TOTAL
- Tags:
- Group_Discussions

 ecolomer
- Mark as New
- Bookmark
- Subscribe
- Mute
- Subscribe to RSS Feed
- Permalink
- Report Inappropriate Content
Can you upload some data example and your expectative?
jood_ahmad
- Mark as New
- Bookmark
- Subscribe
- Mute
- Subscribe to RSS Feed
- Permalink
- Report Inappropriate Content
this the sample.
jood_ahmad
- Mark as New
- Bookmark
- Subscribe
- Mute
- Subscribe to RSS Feed
- Permalink
- Report Inappropriate Content
like we have 7 day in the week and i need to see with this 7 days another line to see the previous AOP on 7 days .
ecolomer
- Mark as New
- Bookmark
- Subscribe
- Mute
- Subscribe to RSS Feed
- Permalink
- Report Inappropriate Content
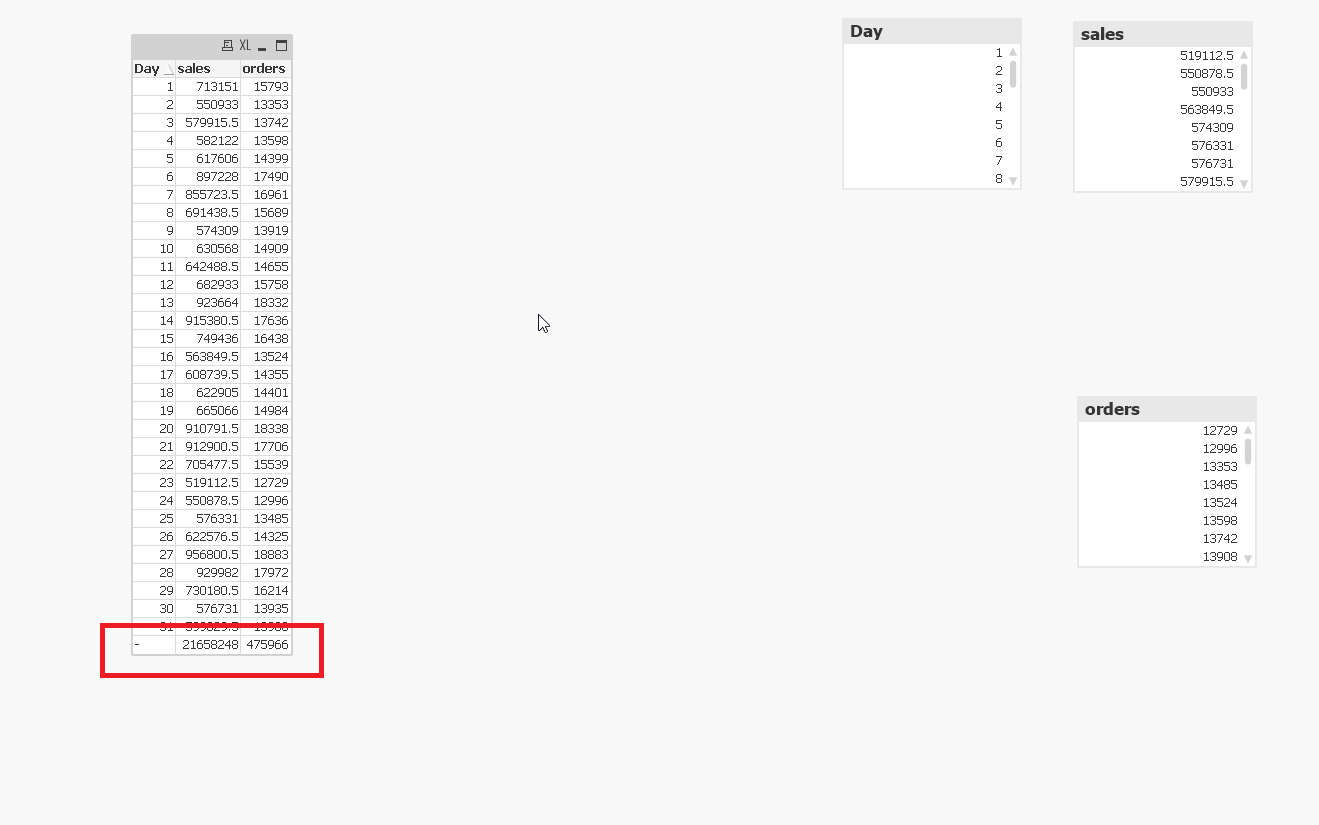
You have a day with no data
jood_ahmad
- Mark as New
- Bookmark
- Subscribe
- Mute
- Subscribe to RSS Feed
- Permalink
- Report Inappropriate Content
THIS IS THE TOTAL OF SALES & TOTAL OF ORDERS.
ecolomer
- Mark as New
- Bookmark
- Subscribe
- Mute
- Subscribe to RSS Feed
- Permalink
- Report Inappropriate Content
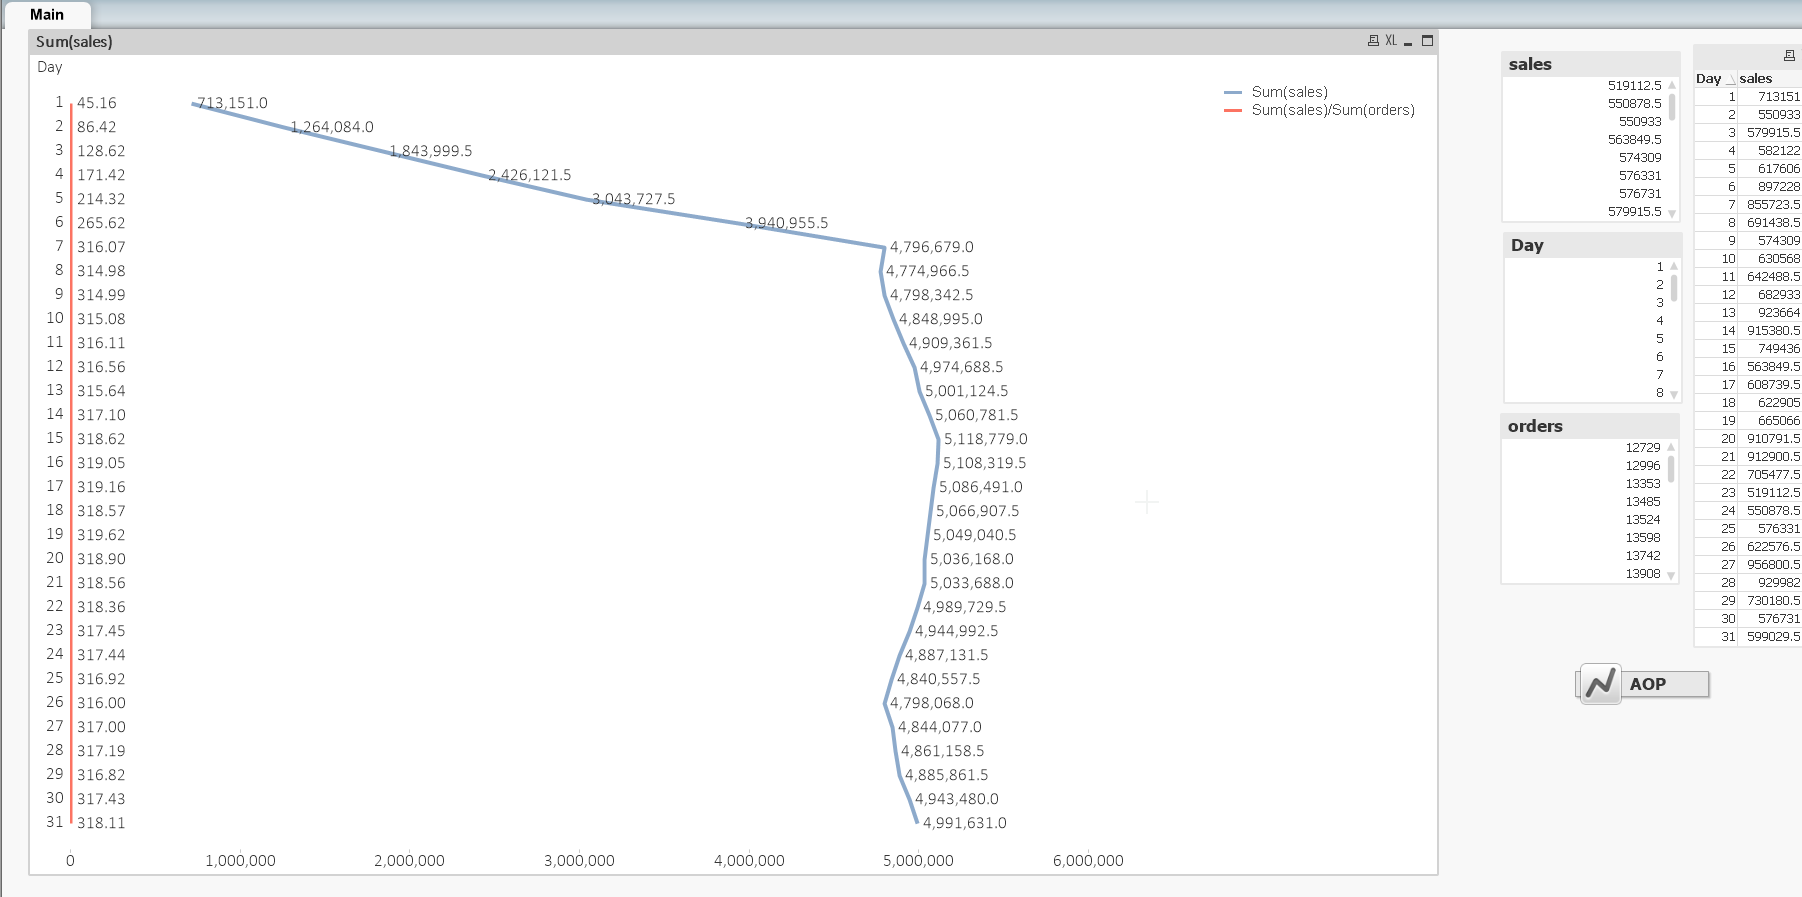
Is that you need?
jood_ahmad
- Mark as New
- Bookmark
- Subscribe
- Mute
- Subscribe to RSS Feed
- Permalink
- Report Inappropriate Content
thank you Enrique Colomer but not exactly.
can you see the attached pic the red line will be for the previous week so i can compare two week in the same time for the AOP.
 ecolomer
- Mark as New
- Bookmark
- Subscribe
- Mute
- Subscribe to RSS Feed
- Permalink
- Report Inappropriate Content
I just do not understand.
Could you prepare some data in Excel and the results you expect?
jood_ahmad
- Mark as New
- Bookmark
- Subscribe
- Mute
- Subscribe to RSS Feed
- Permalink
- Report Inappropriate Content
something like the chart in excel ,
i use the first week and the 2nd week.
