Unlock a world of possibilities! Login now and discover the exclusive benefits awaiting you.

- Qlik Community
- :
- Forums
- :
- Archive
- :
- Archived Groups
- :
- how to make this bar chart.
- Subscribe to RSS Feed
- Mark Topic as New
- Mark Topic as Read
- Float this Topic for Current User
- Bookmark
- Subscribe
- Mute
- Printer Friendly Page

 Naps_230
- Mark as New
- Bookmark
- Subscribe
- Mute
- Subscribe to RSS Feed
- Permalink
- Report Inappropriate Content
how to make this bar chart.
I have bar chart.
How to show two value in bar chart with waterfall design.
example- 1st value- 477.2,0.9,2.3,475.7,465.1,450.0
2nd value-3 .11,3.12,3.12,3.10

Please help....
- Tags:
- Group_Discussions

 sunny_talwar
- Mark as New
- Bookmark
- Subscribe
- Mute
- Subscribe to RSS Feed
- Permalink
- Report Inappropriate Content
May be provide the raw data behind this view and may be we can help you create something similar to above
Naps_230
- Mark as New
- Bookmark
- Subscribe
- Mute
- Subscribe to RSS Feed
- Permalink
- Report Inappropriate Content
Its very huge data. can't share.
sunny_talwar
- Mark as New
- Bookmark
- Subscribe
- Mute
- Subscribe to RSS Feed
- Permalink
- Report Inappropriate Content
May be few 100 rows of anonymous data or share a sample qvw following these directions
Preparing examples for Upload - Reduction and Data Scrambling
Naps_230
- Mark as New
- Bookmark
- Subscribe
- Mute
- Subscribe to RSS Feed
- Permalink
- Report Inappropriate Content
Hi,
Here i give same example where faced problem.
Type, value1, value2
PW ending AUM, 100, 8
Cashflow, 30
market, 20
CW ending AUM, 90, 7
QTD Avg aum, 70, 6
Q3 16 avg aum, 50, 8
i create bar chart.
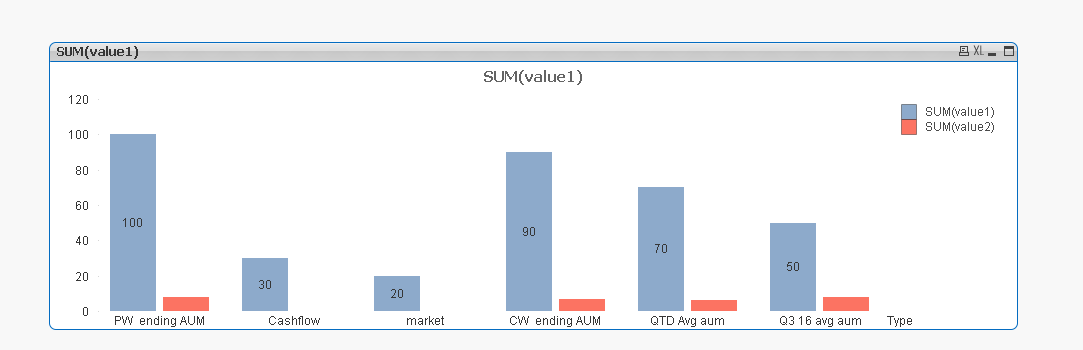
here i want to show value2 data will appear on top of value1 bar.
cashflow and market data also waterfall format.
Like my previous original chart.
sunny_talwar
- Mark as New
- Bookmark
- Subscribe
- Mute
- Subscribe to RSS Feed
- Permalink
- Report Inappropriate Content
The waterfall logic is this?
100 - 30 + 20 = 90?
PW ending - Cashflow + market = CW ending?
