Unlock a world of possibilities! Login now and discover the exclusive benefits awaiting you.
Product Innovation
By reading the Product Innovation blog, you will learn about what's new across all of the products in our growing Qlik product portfolio.
Support Updates
The Support Updates blog delivers important and useful Qlik Support information about end-of-product support, new service releases, and general support topics.
Qlik Academic Program
This blog was created for professors and students using Qlik within academia.
Community News
Hear it from your Community Managers! The Community News blog provides updates about the Qlik Community Platform and other news and important announcements.
Qlik Digest
The Qlik Digest is your essential monthly low-down of the need-to-know product updates, events, and resources from Qlik.
Qlik Learning
The Qlik Learning blog offers information about the latest updates to our courses and programs, as well as insights from the Qlik Learning team.
Recent Blog Posts
-
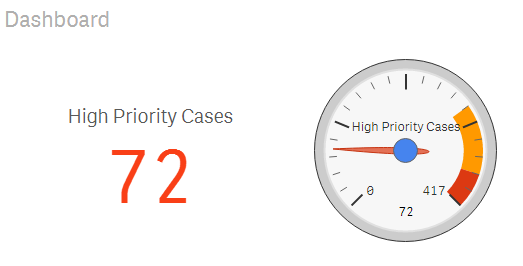
Google Gauge - A Qlik Sense Extension
Since my last blog where I created a Google Annotation Chart (Google Annotation Chart - Qlik Sense Extension and Angular Directive), I thought it would be interesting to add more extensions based on Google's visualization library. Here I created a simple gauge based on Google's Gauge found at Visualization: Gauge | Charts | Google Developers. Download the zip file as found at the end of this blog,unzip it in your extensions folder, ... Show MoreSince my last blog where I created a Google Annotation Chart (Google Annotation Chart - Qlik Sense Extension and Angular Directive), I thought it would be interesting to add more extensions based on Google's visualization library.
Here I created a simple gauge based on Google's Gauge found at Visualization: Gauge | Charts | Google Developers.
- Download the zip file as found at the end of this blog,
- unzip it in your extensions folder, C:\Users<user>\Documents\Qlik\Sense\Extensions\GoogleGaugeChart
- Open your Helpdesk app and drag and drop the extension into the canvas
- As for the first measure put
Count( {$<Priority={'High'}, Status -={'Closed'} >} Distinct %CaseId )with a label "High Priority Cases" - For the second measure, put
Count( {$<Status -={'Closed'} >} Distinct %CaseId ) - with a label "Total Closed Cases"
- Make selections and see the Gauge animate
Coming up: Extension settings...
Branch: http://branch.qlik.com/#!/project/57b76c10b3122e2cd1e7305d
Yianni
-
Redefining the Week Start in Qlik Sense
Last year I wrote a blog post on how to set Sunday as the first day of the week, instead of using the ISO 8601 default. This is fairly straight forward – all you need to do is to write some formulas in the script. See Redefining the Week Start.However, if you use Qlik Sense it has become even simpler. You don’t need any custom formulas and usually it just works - without you doing anything.When you create your Qlik Sense app, a number of environm... Show MoreLast year I wrote a blog post on how to set Sunday as the first day of the week, instead of using the ISO 8601 default. This is fairly straight forward – all you need to do is to write some formulas in the script. See Redefining the Week Start.
However, if you use Qlik Sense it has become even simpler. You don’t need any custom formulas and usually it just works - without you doing anything.
When you create your Qlik Sense app, a number of environment variables are created in the beginning of the script. These variables are based on regional settings of your computer, so usually you don’t need to change any of them. One of the variables is “FirstWeekDay” and this defines which day of the week you want to use as your first day.
If you want Monday, then you should use
Set FirstWeekDay = 0; // 0=Mon, 1=Tue, ... , 6=Sun
And if you want Sunday, you should use
Set FirstWeekDay = 6; // 0=Mon, 1=Tue, ... , 6=Sun
Change it if you need to!
This variable is used as default for several functions, most notably WeekDay() and WeekStart(). So when you call these functions, you will automatically get the correct week start and the correct order of the week days.
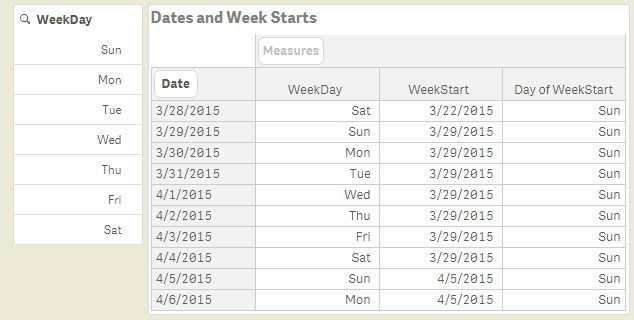
If you use FirstWeekDay=6, you will get a result like in the picture above. You can clearly see that both the order of the week days (in the filter pane to the left) and the week starts (in the pivot table) are correctly defined. I have used US settings and the following expressions to define these fields:
WeekDay( Date ) as WeekDay,
WeekStart( Date ) as WeekStart,
WeekDay( WeekStart( Date ) ) as [Day of WeekStart],
The environment variable changes the defaults of these functions, but you can of course also override the default by using an explicit parameter in the function call:
WeekDay( Date, $(MyFirstWeekDay) ) as MyWeekDay,
WeekStart( Date, 0, $(MyFirstWeekDay) ) as MyWeekStart,
With Qlik Sense, we have made the date and time management a lot easier.
PS This functionality does not yet exist in QlikView.
Further reading related to this topic:

-
What’s new in Qlik Sense 3.0 – Bubbles (Visual Data Preparation)
Creating a reliable data model becomes in one of the key factors to a successful project, data visualization, chart, dashboard, or report. Quite a few times creating an effective model is not the easiest task to perform due several reasons, poor data quality, or unstructured data sources, etc. Even when we have a pristine normalized data model we may face some issues on how to associate our data easily. To help us with the crucial mission of mana... Show MoreCreating a reliable data model becomes in one of the key factors to a successful project, data visualization, chart, dashboard, or report. Quite a few times creating an effective model is not the easiest task to perform due several reasons, poor data quality, or unstructured data sources, etc.
Even when we have a pristine normalized data model we may face some issues on how to associate our data easily.
To help us with the crucial mission of managing data associations from multiples sources and building a great data model Qlik Sense 3.0 (sorry QlikView fans) release included the so called "bubbles" feature.
How it works?
All this works through Qlik Data Manager, when more than one table is loaded we can access to the association's view where a circle or a bubble symbolizes each one of the loaded tables. The size of the bubble represents the table’s size so the larger the bubble the more rows of data it contains.
The fun part is to interact with the bubbles, you can click one and explore its contents, or you could click and press on a bubble and see how Qlik Sense will recommend you possible associations using color coding. Highly recommended associations are marked with green, and medium recommendations are orange.
To confirm an association you just need to drag one bubble to another table and see the magic happen. It not only will capture and match the column with identical names but it will also scan the data content to suggest you with the best possible link.
If you want to get more control you can always edit or break the suggested associations and use your criteria to set up a custom association. Alternatively users can let Qlik Sense create associations between all added data tables according to recommendations based on data analysis by clicking on the magic stick icon.
Once you’re happy with your data model just press on Load Data button and you’re good to go.
For a more comprehensive demo and demo sample files please check out Michael Tarallo material here.
Enjoy Qliking
AMZ

-
Are Grades Getting In The Way Of Our Learning?
How “flipping” the way we teach and assess students will actually improve their learning.Today most classes conduct quizzes offering binary grades: you either pass, or fail, or somewhere in between. As a student, what can you learn or apply from this type of grading? Not much, unfortunately. All of these learning approaches are actually getting in the way of how adult students should learn. There’s a better way: flip the classroom, flip the ... Show MoreHow “flipping” the way we teach and assess students will actually improve their learning.

Today most classes conduct quizzes offering binary grades: you either pass, or fail, or somewhere in between. As a student, what can you learn or apply from this type of grading? Not much, unfortunately. All of these learning approaches are actually getting in the way of how adult students should learn. There’s a better way: flip the classroom, flip the assessment.
To learn more visit this months blog post at
http://global.qlik.com/us/blog/posts/kevin-hanegan/are-grades-getting-in-the-way-of-our-learning

-
Hidden gems in Qlik Sense geospatial functions
Today I'll be posting on behalf of Yang Yang who recently came up with this interesting article around the geospatial functions available in Qlik Sense, I'm sure you'll enjoy it.Arturo Qlik Sense is Gorgeous and Genius. So far, you probably have seen the intelligent visualizations that are out-of-the-box in Qlik Sense, including maps. What about advanced geospatial functions such as merging geometries or the converting spatial projections? Will t... Show MoreToday I'll be posting on behalf of Yang Yang who recently came up with this interesting article around the geospatial functions available in Qlik Sense, I'm sure you'll enjoy it.
Arturo
Qlik Sense is Gorgeous and Genius. So far, you probably have seen the intelligent visualizations that are out-of-the-box in Qlik Sense, including maps. What about advanced geospatial functions such as merging geometries or the converting spatial projections? Will those features be added in Qlik Sense product? I recently bumped into a few geospatial functions that are not yet well known. Here are the findings from my experimenting of those functions. The QVF and supporting data are also available for download at the bottom of the article.
Two categories of functions
There are two categories of these geospatial functions: aggregation and non-aggregation.
Aggregation functions will take the input of a set of geometries (points or areas) and output with one geometry. For example, you can merge multiple areas together and draw a single boundary for the aggregation on the map. On the other hand, non-aggregation function will only take the input of one geometry and then output one geometry. For instance, you provide the boundary geometry of one area to a function called GeoGetPolygonCenter, it will return the point geometry (longitude and latitude) for the center of that area.
There are two types of parameters that may required by the geospatial functions:
- Geometry, can be any of the following:
- a point (latitude, longitude)
- an area
- Projection, With Mercator projection you can represent maps in square format, correcting for the distortion created by stretching. This can be any of the following:
- 'unit' (default) - projection is 1:1
- 'mercator'
Aggregation functions
There are five aggregation functions available in the current release of Qlik Sense (1.0.1).
GeoAggrGeometry
This function can be used to aggregate a number of areas into a larger area, for example aggregating a number of sub-regions to a region.
GeoAggrGeometry(geometry).
A typical use case of this function is: A company has geospatial boundary data for each postcode areas in Sydney and the sales revenue from each area. A sales person has his or her sales territory that covers a number of postcode areas. The sales territory will be adjusted from time to time and there's no geospatial data for the boundary of this changing territory. How can the company present the total of sales by region on a color filled map?
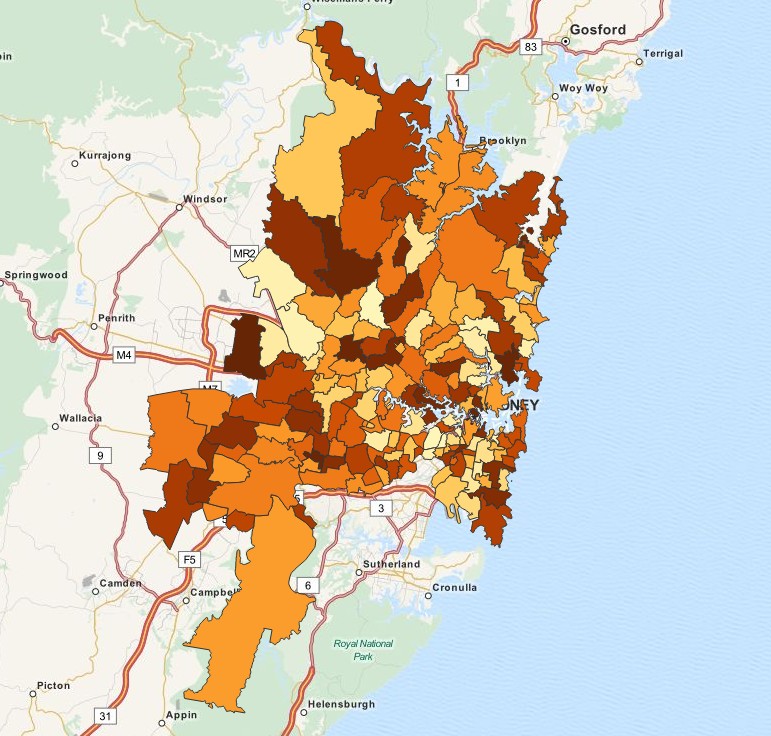
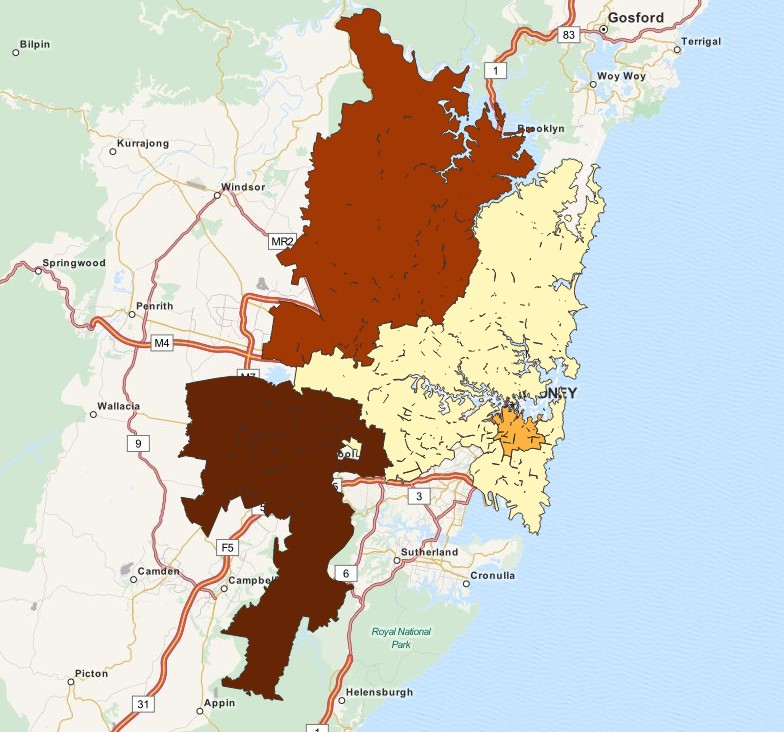
With GeoAggrGeometry(), we can calculate the aggregation of multiple suburb level geometries and generated the merged territory geometry in the data model. If the sales territory changes, the new merged boundary can be reflected on map after the reload.
GeoReduceGeometry
This function can be used in scripts to aggregate a geometry into an area.
GeoReduceGeometry(geometry)
This function is similar to GeoAggrGeometry(). The only difference is, though the areas are aggregated, area level boundary lines are still kept on the map display.
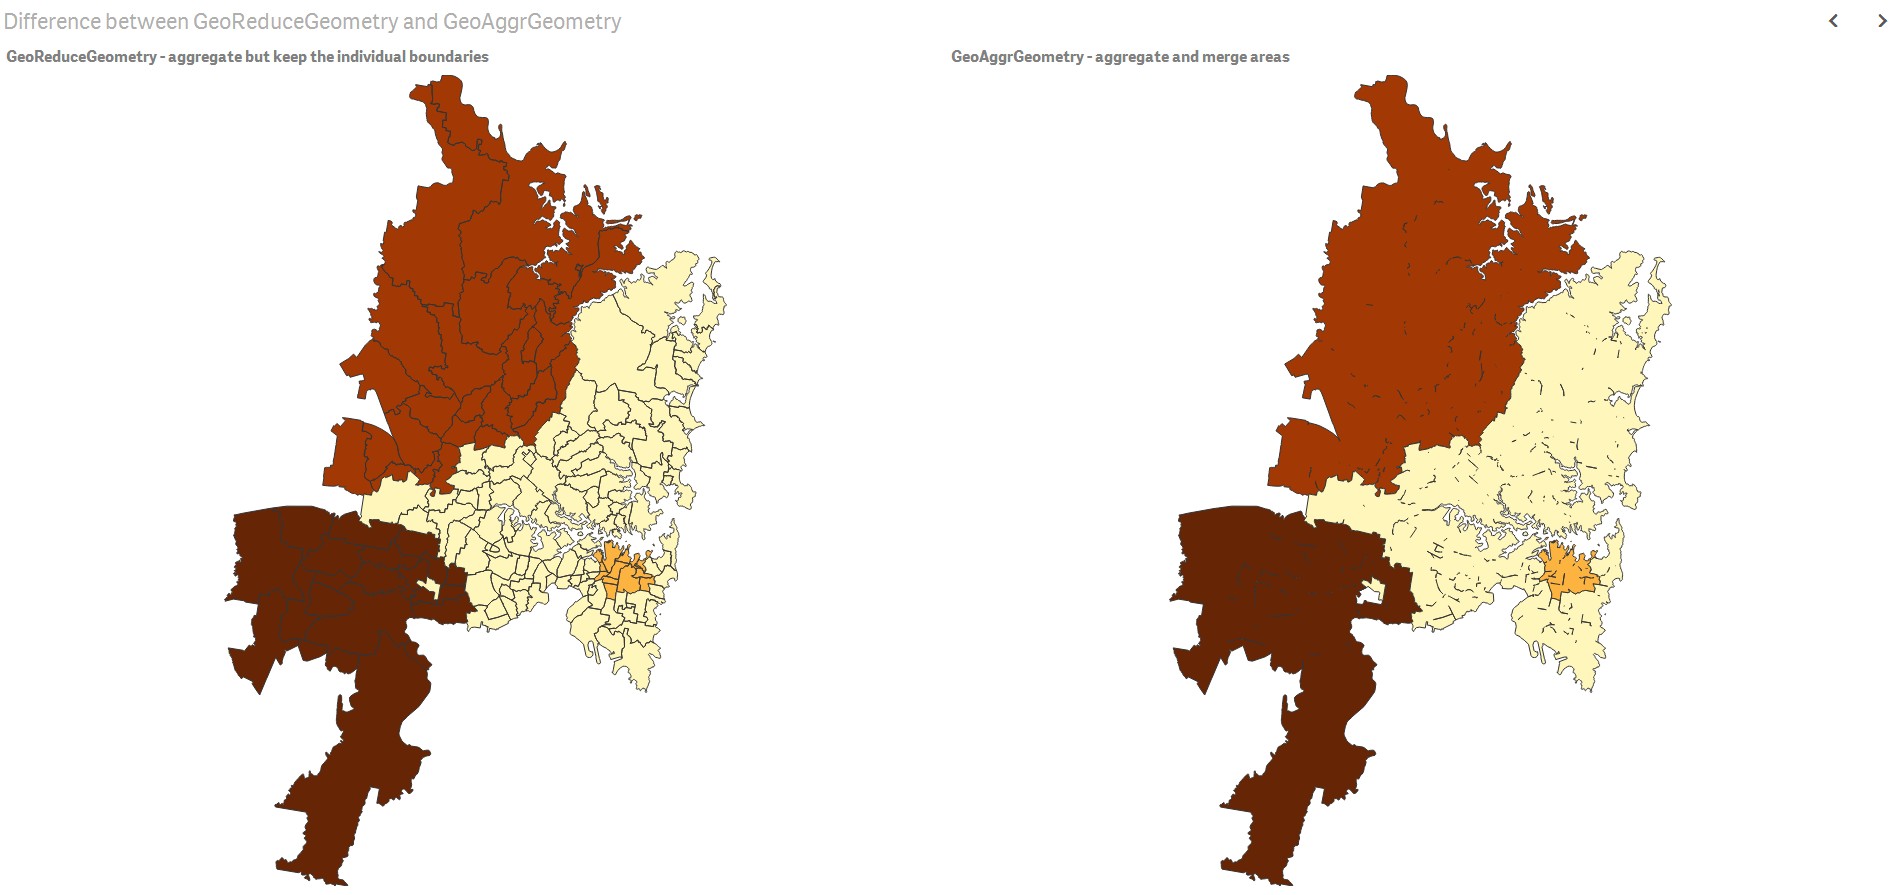
GeoBoundingBox
This function can be used in scripts to aggregate a geometry into an area and calculate the smallest GeoBoundingBox that contain all coordinates.
A GeoBoundingBox is represented as a list of four values: left, right, top, bottom.
As explained above, this function will firstly aggregate a set of geometries together, then it will produce four coordinates for the smallest rectangle that contains all the coordinates of that aggregated geometry.
 To visualize the result on map, you need to transfer the 4 coordinates string into ordinary polygon format, tag the transferred field with certain geopolygon format, drag and drop that field into the map object, then you can see rectangle boxes.
GeoInvProjectGeometry
This function can be used in scripts to aggregate a geometry into an area and apply the inverse of a projection.
GeoInvProjectGeometry(projection, geometry)
GeoProjectGeometry
This function can be used in scripts to aggregate a geometry into an area and apply a projection.
GeoProjectGeometry(projection, geometry)
Non-aggregation functions
There are four non-aggregation geospatial functions in the current release of Qlik Sense (1.0.1).
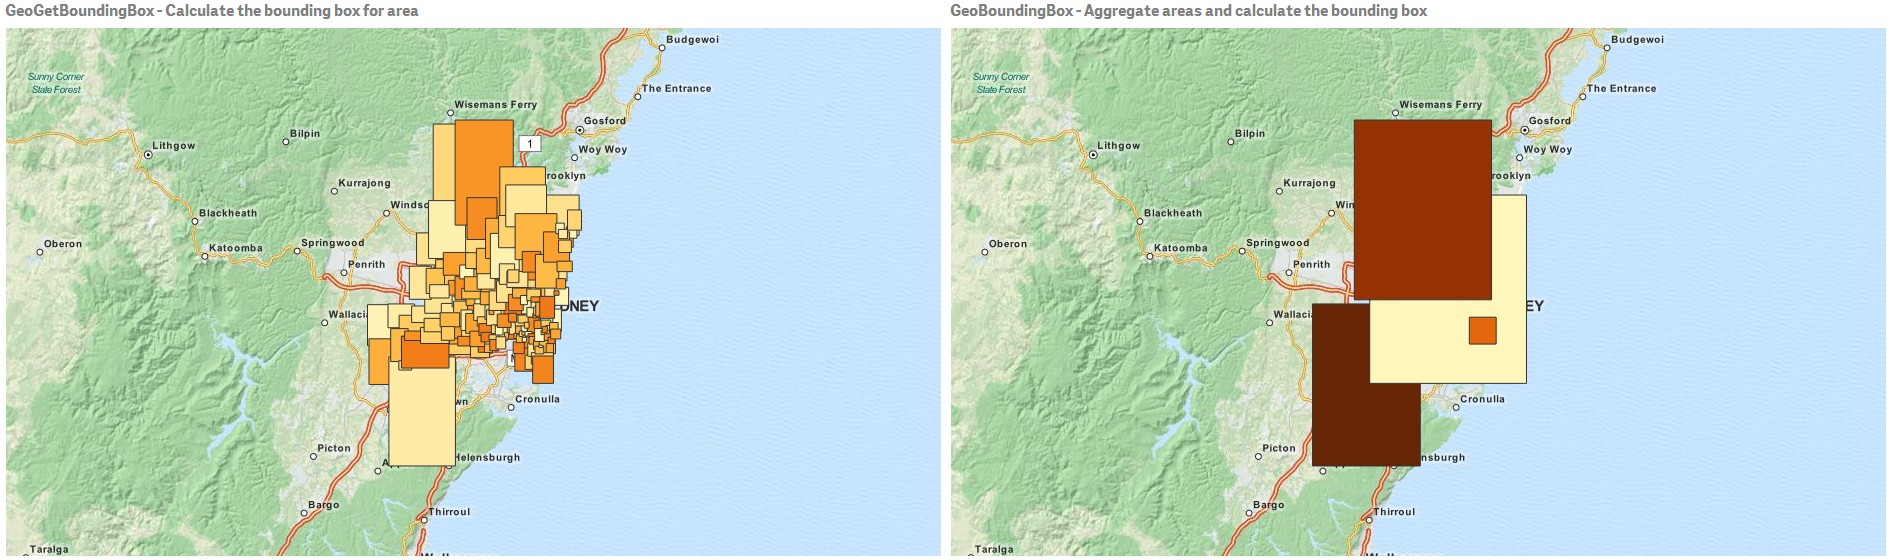
GeoGetPolygonCenter
This function can be used in scripts and chart expressions to calculate and return the center point of a geometry.
GeoGetPolygonCenter(geometry)
In some case, we want to plot dot instead of color fill on map. If the existing geospatial data is only available in the form of area geometry (e.g. boundary), we need function that can retrieve one pair of longitude and latitude for the center of area. Therefore, GeoGetPolygonCenter() is provided in Qlik Sense.
For example, we can still create bubble map like below to plot the central points of Sydney suburbs, though we only have boundary information in the data source.
GeoGetBoundingBox
This function can be used in scripts and chart expressions to calculate the smallest GeoBoundingBox that contain all coordinates of a geometry.
A GeoBoundingBox is represented as a list of four values, left, right, top, bottom.
As described in the previous section, with a few extra steps, you can visualize rectangle boxes on a map object.
GeoProject
This function can be used in scripts and chart expressions to apply a projection to a geometry.
GeoProject(projection, geometry)
This is a projection function for a single geometry. As explained in the previous section, this function will be useful for map areas that are close to the north or south pole.
GeoMakePoint
This function can be used in scripts and chart expressions to create and tag a Point with latitude and longitude.
GeoMakePoint(latitude, longitude)
Those non-aggregation functions can be called in load script. Error message will be thrown if they are used together with "group by" clause.
It's exciting to play with the brand new geospatial functions. When you enjoy discovering more business insights with those out-of-the-box features, please remember, this is just the beginning of Qlik Sense.
Yang Yang - Qlik Senior Solution Architect
-
Qlik Lars Mashup Project Template
Who this project template is forDevelopers creating Qlik Sense mashups with Qlik Sense 3.0 or above, who have at least a decent understanding of Angular.js and Require.js and would like to use a project template to speed up development.Who this isn't forAnyone only looking for a predesigned layout in which to simply add Qlik Sense objectsProject Template OverviewThis project template helps organize all your config code in one place, and provides ... Show MoreWho this project template is for
Developers creating Qlik Sense mashups with Qlik Sense 3.0 or above, who have at least a decent understanding of Angular.js and Require.js and would like to use a project template to speed up development.
Who this isn't for
Anyone only looking for a predesigned layout in which to simply add Qlik Sense objects
Project Template Overview
This project template helps organize all your config code in one place, and provides you with a decent architecture for a component based approach to an angular app. It has a few useful prebuilt components specific to qlik sense mashups, which use a nice pattern which can be borrowed to create more components.There's also a gruntfile to compile less and build your app using the r.js optimizer. I'll go over the parts of the template now.
main.js
The project template has a top level main.js file that contains the config code for the Qlik Sense Root API and Require.js, and acts as the entry point for most of the proejct, requiring the Qlik Sense API code as well as all the project app code. It's here, for instance, that you can change the the app id you would like to connect to, and add paths and shims to require. The default Require.js context is used for loading the Qlik Sense API code, while a second context, named "requireApp", is used to require the app code from the app folder.
app.js
This file is found under the app folder, and is the entry point for the app. The main app angular module is created here, the templates are loaded, and the angular app is bootstrapped with the project app and Qlik Angular API app.
qlikApp
This is an angular service which opens a Qlik Sense app using the Root API with the app id specified in the main.js file, and provides access to it throughout the rest of your app. The service also has methods which can be used in place of the App API createCube, createGenericObject, createList, and createTable methods, which act just like the corresponding App API methods, but allow you to pass $scope as a parameter, which then takes care of the destruction of session objects when their scope is destroyed.
senseObject
This component gives you the ability to use the App API getObject method as a directive, with the added functionality of closing the object when its scope is destroyed.
search
This component exposes the App API getResults method as an easy to use directive, using the typeahead from UI Bootstrap to display results, and allowing selections from those results.
dropdown
This is a directive for a dropdown component, which allows you to add a field from the Qlik Sense app and make selections. It displays the name of single selections, or the count of multiple selections, as well as indicating the state of each individual value in the dropdown. It also makes use of virtual scrolling, to prevent too many watchers.
examples
This is a view component which is simply here as an example. It requires the dropdown, search, and senseObject components and uses them, and is itself required by the app.js file and injected into the main angular app module.
gruntfile
The gruntfile is configured to compile all of the less in each individual component, as well as the main.less file located in css/less folder, compile the templates.js file from all html files found in components, and run the r.js optimizer from the app entry point.
How to get it
You can find this project on Qlik Branch @ Qlik Lars Project Template
-
How do you handle "Big Data"?
Greetings Qlik Community. I pleased to introduce you to our newest Guest Blogger, David Freriks. David is a Technology Evangelist on the Innovation and Design team at Qlik. He has been working in the "big data" space for over three years, starting with Hadoop and moving onto Spark in this continuously evolving ecosystem. He has 18+ years in the BI space, helping launch new products to market. David is here today to discuss a few approaches on how... Show More
Greetings Qlik Community. I pleased to introduce you to our newest Guest Blogger, David Freriks. David is a Technology Evangelist on the Innovation and Design team at Qlik. He has been working in the "big data" space for over three years, starting with Hadoop and moving onto Spark in this continuously evolving ecosystem. He has 18+ years in the BI space, helping launch new products to market. David is here today to discuss a few approaches on how Qlik can address...."Big Data".
"Big Data"
The term "Big Data" has been thrown around for several years, and yet it continues to have a very vague definition. In fact, there are no two big data installations and configurations alike – insert snowflake paradigm here.
 It’s no surprise, given the unique nature of “big data”, it cannot be forced into an abstract model. These type of data systems evolve organically, and morph based on the ever changing business requirements.
 If we accept that no two big data systems are alike, how can one deliver analytics from those systems with a singular approach?
Well, we can’t – in fact it would be quite limiting to do so. Why?
Picking one and only one method of analysis prevents the basic question “What problem is the business user trying to solve?” from being answered. So what do I mean by “picking one version of analysis”?
The market breaks it down into the following narrow paths:
- Simple SQL on Hadoop/Spark/etc.
- Some form of caching of SQL on Hadoop/Spark/etc
- ETL into database then analysis
These solutions have their place, but to pick only one greatly limits a user’s ability to succeed, especially when the limits of each solution are reached.
So how does Qlik differentiate itself from the narrow approaches and tools that exist in the market?
Simple answer, variety. Qlik is in a unique position that offers a set of techniques and strategies that allow the widest range of capabilities within a big data ecosystem.
Below are some of the approaches Qlik addresses the big data community with:
- In-Memory Analytics: Get the data you need and accelerate it, which provides a great solution for concepts such as data lakes. Qlik creates a “Synch and Drink” strategy for big data. Fast and powerful, but does not retrieve all the data, which might be ok given the requirements. Think of it as a water tower for your data lake. Do you really need 1 petabyte of log data, or maybe just the errors and anomalies over the last 30 days?
- Direct/Live Query: Sometimes you do need all the data, or a large set that isn’t realistic to fit into memory, or latency is a concern – then use Qlik in live query mode. The catch with this strategy is you are completely dependent on the source system to provide speed. This scenario is best when an accelerator (Teradata, Jethro, atScale, Impala, etc) is used as a performance booster. Qlik uses our Direct Discovery capability to enable this scenario
- On-Demand-App-Generation: This is a “shopping cart” approach that allows users to select from a cart of content curated from the big data system. By guiding the users to make selections this technique reduces the raw volume of data being returned from a system to just what they need, it also allows IT to place controls, security, and limiters in front of those choices so mistakes (trying to return all records from a multi-petabyte system) can be avoided.
- API - App on Demand: This is a API evolution of the shopping cart method above but embedded within a process or environment of another interface or mashup. This technique allows Qlik apps to be created temporarily (i.e. session app) or permanently based on the inputs from another starting point. This is an ideal solution for big data partners or OEM’s who would like to build Qlik integration directly into their tool.
In summary, to prevent limited interactions with whatever “big data” system you use, you need options. Qlik is uniquely positioned in this area due to the power of the QIX engine and our ELT + Acceleration + Visualization three-in-one architecture. Since no two big data systems are alike, Qlik offers the most flexibility with solutions in the market to adapt to any data scenario big, or small.
Regards,
David Freriks
Emerging Technology Evangelist
Follow me: David Freriks (@dlfreriks) | Twitter

-
Visual Search
Qlik Sense 3.0 has expanded the capabilities of Smart Search by including visual results when you perform a search in your Qlik Sense app. Not only can you search for field and dimension values in your data model, you can now search chart types, chart names (titles, subtitles and footnotes), dimension and measure definitions and labels.Let’s use the Consumer Goods Sales demo to see some of the ways the Visual Search works. To begin a search you... Show MoreQlik Sense 3.0 has expanded the capabilities of Smart Search by including visual results when you perform a search in your Qlik Sense app. Not only can you search for field and dimension values in your data model, you can now search chart types, chart names (titles, subtitles and footnotes), dimension and measure definitions and labels.
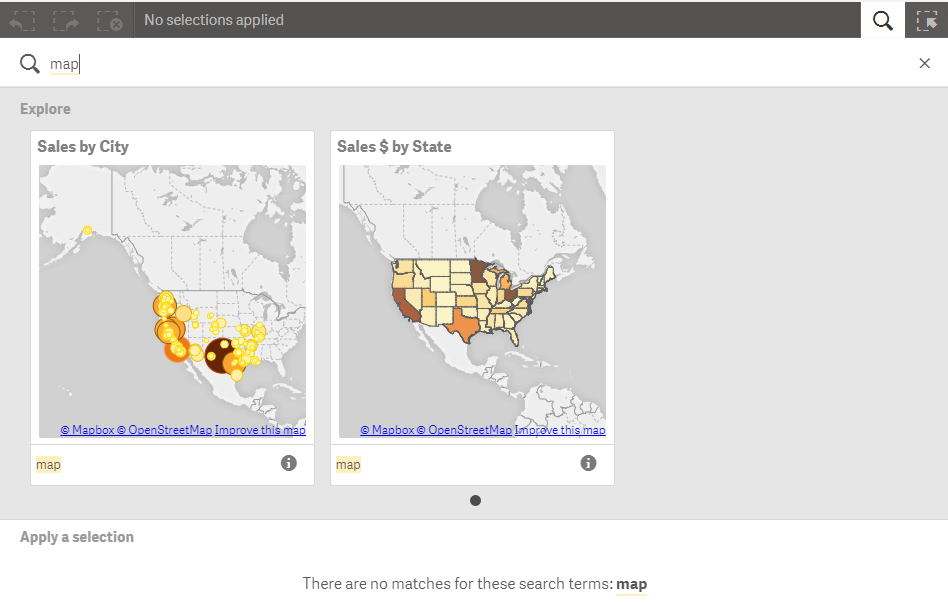
Let’s use the Consumer Goods Sales demo to see some of the ways the Visual Search works. To begin a search you simply click the Search icon in the upper right corner of the sheet. Say I want to find all maps in my app. I can search for map and the results will show me the map objects in my app. I can click on the map to view it on the sheet.
My map search did not return any results (in the Apply a selection section) that I could make selections on so let’s do another search to see where I have used the Product dimension in my app. In the image below you can see that this search returns not only visualizations but data fields that I can make selections on. I can navigate through the visualizations returned by my search by using the arrow on the right. At the bottom in the Apply a selection section, I can make a selection in the search results to filter the data in my app.
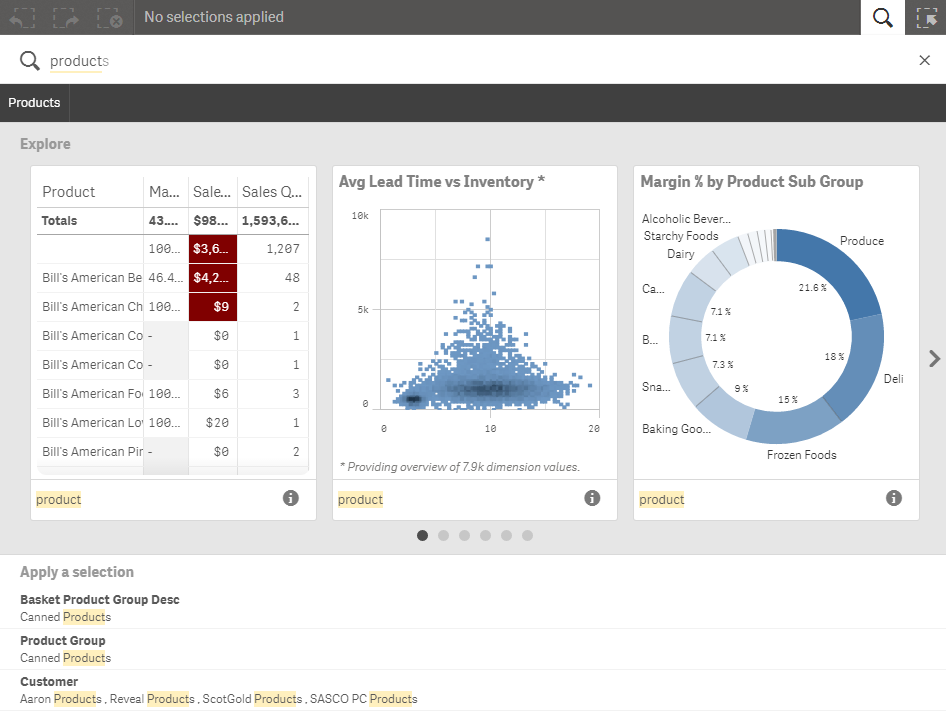
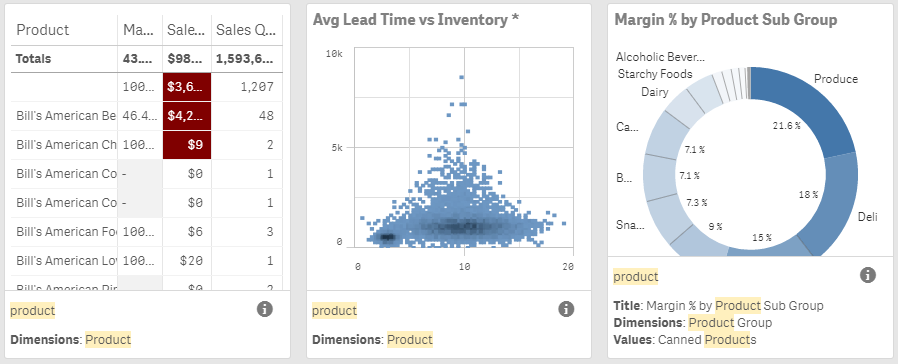
Under the charts in the Explore section there is an info icon. Clicking this icon will show where my search string was found in the chart. For instance in the first chart, the Product dimension was used in the chart. In the third chart, product was found in the title, dimension name and data value.
Above you can see how we can search for a dimension. The same can be done for a measure but note that the search does not return measure values. I really like the ability to search measures because now I can quickly check to see if I am using a specific field in one of my measures without manually checking each measure. In this example, I want to see where I am using the Sales Amount field in my app. If I search for “Sales Amount” with double quotes, I can find all the charts that use this field in the measure.
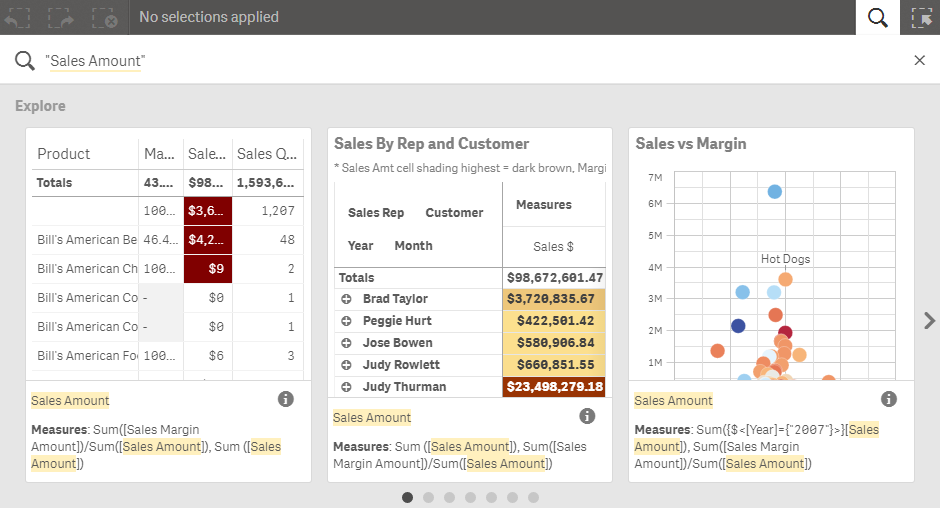
In this example, I used double quotes because I knew the field was named Sales Amount. If I did not use the quotes, the search would have searched for the words Sales and Amount separately. Arturo Munoz created a Qlik Sense Search Cheat Sheet that has some helpful tips on performing searches.
The new Visual Search in Qlik Sense 3.0 expands the search capabilities that can be performed in an app by searching objects and master items as well as field values making it easier to find what you are looking for and to filter your data. Michael Tarallo created a brief video on this new feature – check it out!
Thanks,
Jennell
-
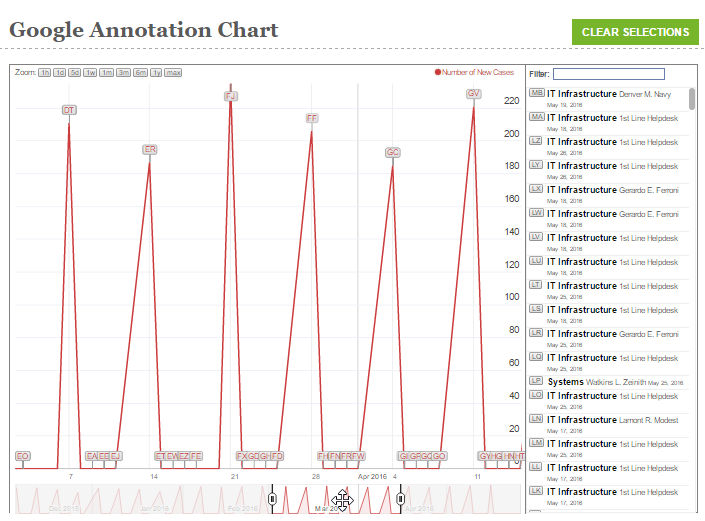
Google Annotation Chart - Qlik Sense Extension and Angular Directive
In a project that I am currently working on, we thought that it would be a great idea, if we displayed data much like Google Finance, with line chart and annotations. Of course this does not currently exist in Qlik Sense so I decided first to create it in my Angular Template (Qlik Branch). Once that was done, I moved it into a directive for easier distribution and then created an extension for it, so we can use it in other projects straight from ... Show MoreIn a project that I am currently working on, we thought that it would be a great idea, if we displayed data much like Google Finance, with line chart and annotations. Of course this does not currently exist in Qlik Sense so I decided first to create it in my Angular Template (Qlik Branch). Once that was done, I moved it into a directive for easier distribution and then created an extension for it, so we can use it in other projects straight from Sense without the need of my template.
For the Directive, we need to define the options in our controller like:
$scope.googleAnnotation = {
  id: 'cases',
  title: 'New Cases by Department over time',
  height: 600,
  dimensions: [
    'Case Created Date',
    'Case Owner Group', // Title
    'Case Owner', // Description
  ],
  measures: [
    "=Sum([Number of New Cases])",
  ],
  headers: ['Date', 'Number of New Cases','Case Owner Group','Case Owner'],
  options: {
    displayAnnotations: true,
    colors: ['#cc3c3c','#395878','#c88d8d','#6f92b5'],
    displayAnnotationsFilter: true,
    displayDateBarSeparator: true,
    displayZoomButtons: true,
    displayRangeSelector: true,
    thickness: 2,
  },
  }
  $scope.dt = {
    from: new Date(2015, 0, 1),
    to: new Date(2015, 3, 1)
  };
And in our html view
<google-annotation-chart data-data="googleAnnotation" data-dt="dt"></google-annotation-chart>For this example I am connected to helpdesk that is bundled in Qlik Sense Desktop.
We have to get the data in this specific order, Date, Annotation Title, Annotation Description, X-Axis data for the first line as a measure
dimensions: [
    'Case Created Date',
    'Case Owner Group', // Title
    'Case Owner', // Description
  ],
  measures: [
    "=Sum([Number of New Cases])",
  ],
There are some headers that appear on top of the line chart as we move our mouse. We define those in the headers array
headers: ['Date', 'Number of New Cases','Case Owner Group','Case Owner'],
The options are described here and you can pass any of those if you want:
Annotation Chart | Charts | Google Developers
The final results should look like
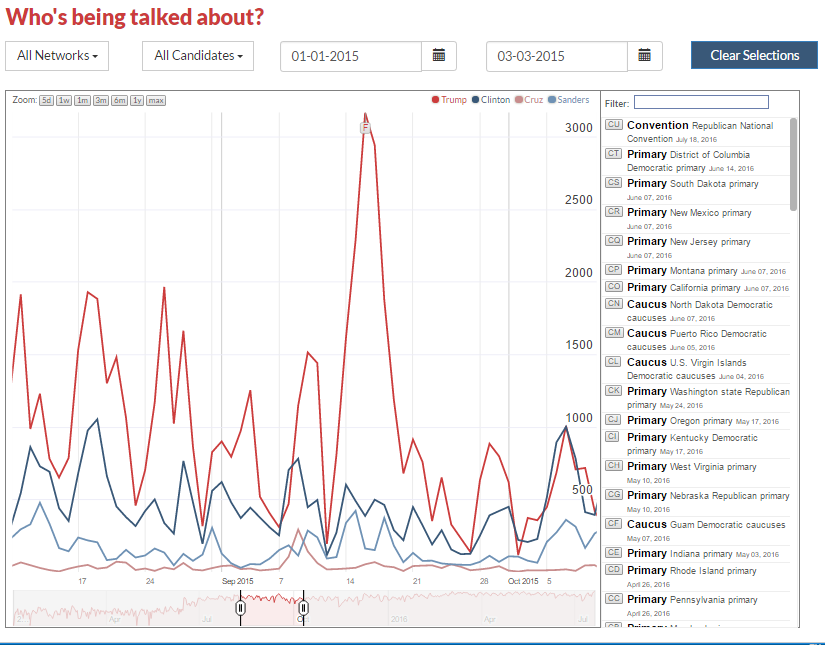
Here is another version for the Presidential Election where we pass selections and zooming, found at
For the Extension, you can get it from
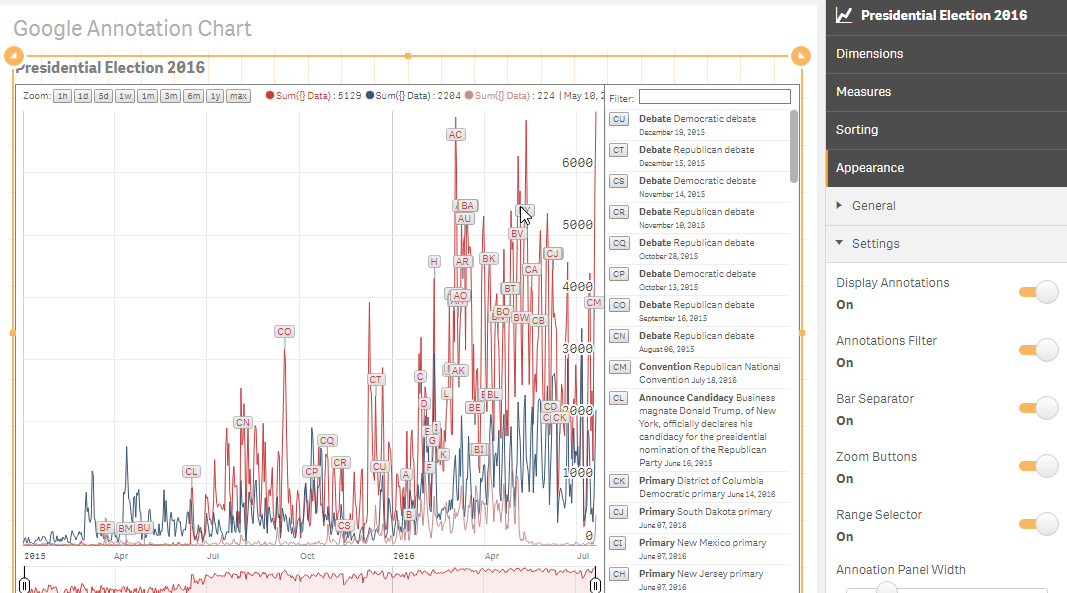
The various settings that I have so far:
- Display Annotations
- Annotations Filter
- Bar Separator
- Zoom Buttons
- Range Selector
- Annoation Panel Width
- Line Headers (In single quotes separated by comma)
- Line Colors (HEX value separated by comma)
- Line Thickness
For installation instructions and usage, please follow the guidelines at the project's homepage.
Angular Template:
Directive Example :
http://webapps.qlik.com/yianni/playground/index.html#/google-annotation-chart
Google Referance:
Annotation Chart | Charts | Google Developers
Download Extension from:
GitHub - yianni-ververis/google-annotation-chart: Google Annotation Chart
Yianni
-
Solving the Data Literacy Gap
How Qlik is helping address today’s skill gap in analytics and data visualization.According to a recent CNN report, over 8 million Americans alone are looking for a job, and many of them do not have the necessary skills to apply for those jobs. What is being done about it? Universities are adding in analytics-related majors and minors and companies are trying to pivot faster to create more on-the-job training to address the skills gap. At Qlik,... Show More
How Qlik is helping address today’s skill gap in analytics and data visualization.
According to a recent CNN report, over 8 million Americans alone are looking for a job, and many of them do not have the necessary skills to apply for those jobs. What is being done about it? Universities are adding in analytics-related majors and minors and companies are trying to pivot faster to create more on-the-job training to address the skills gap.
At Qlik, we recognize the skills gaps and that students preparing for careers in today’s global data-driven environment need to raise the bar to succeed. As a result, over the last several years, Qlik has been providing free software and learning resources to universities through the Academic Program.
To continue to meet a growing demand, Qlik is excited to add a Data Analytics curriculum to the program which covers analytics and visualizations. This curriculum can be used by professors to help ensure that they are instructing with the best course material. It is not sufficient to just teach people how to create a bar chart, if they don't know how to interpret it, and ask basic analytic questions of it. Students need to understand ‘why’ and be able to interpret data in an analytic way; this curriculum will help them with that.
In addition, Qlik is also pleased to announce that we are now providing free access to our self-service online learning platform, Qlik Continuous Classroom (qcc.qlik.com) to all program participants. The Qlik Continuous Classroom provides not just training on Qlik’s products, but also best-in-class training on analytic concepts, basic statistics, data visualization techniques and best practices.
To read the full story visit Solving the Data Literacy Gap | Qlik
To learn more about the Qlik Academic Program visit The Qlik Academic Program
-
Tips to Polish Your Qlik Sense App
In this blog, I am going to discuss some things you should do before you publish and/or share your Qlik Sense app with others. These tips are steps that can be taken to improve the user experience whether they are simply viewing the app or making edits to the app.The first set of tips is around Descriptions – provide descriptions wherever you can to help users understand what they are viewing.Add an app description to your app. This provides an... Show MoreIn this blog, I am going to discuss some things you should do before you publish and/or share your Qlik Sense app with others. These tips are steps that can be taken to improve the user experience whether they are simply viewing the app or making edits to the app.
- The first set of tips is around Descriptions – provide descriptions wherever you can to help users understand what they are viewing.
- Add an app description to your app. This provides an overview of what the app is all about.
- Add sheet descriptions to your app. Offer a sentence or two about the sheet explaining the analysis that can be done on that sheet.
- Add comments to your script, if necessary, to make it easier for you or someone else who may update or edit it in the future.
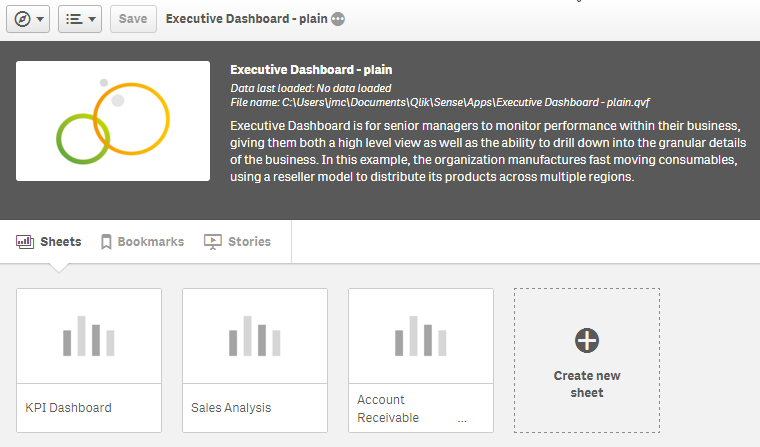
- Jazz it up a bit. Add an app thumbnail and sheet thumbnails to your app to improve the look of the app from the App Overview page. Which App Overview is more appealing to you? This one:
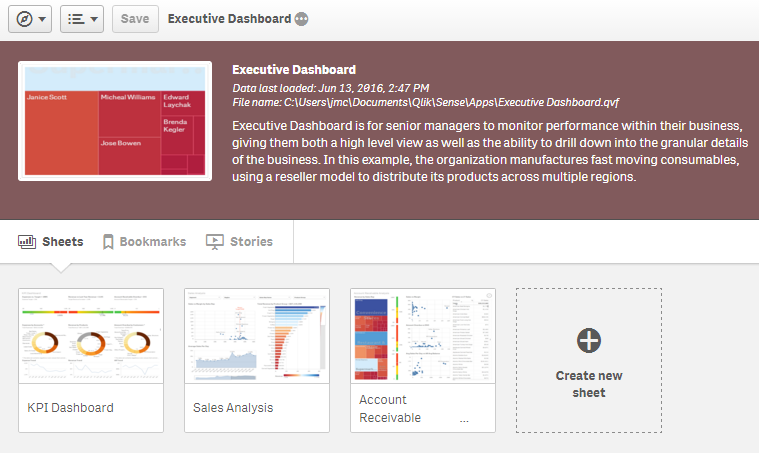
Or this one?
- Organize your app so that it flows nicely. Make sure your sheets and the objects on the sheets are in a logical order. Keep sheet objects to a few and do not clutter the sheet – less is more.
- Be Consistent throughout the app. Here are some examples of what I mean:
- Have a consistent layout - If you have filters on your sheets, place them in the same area on all sheets so the user knows where to expect them.
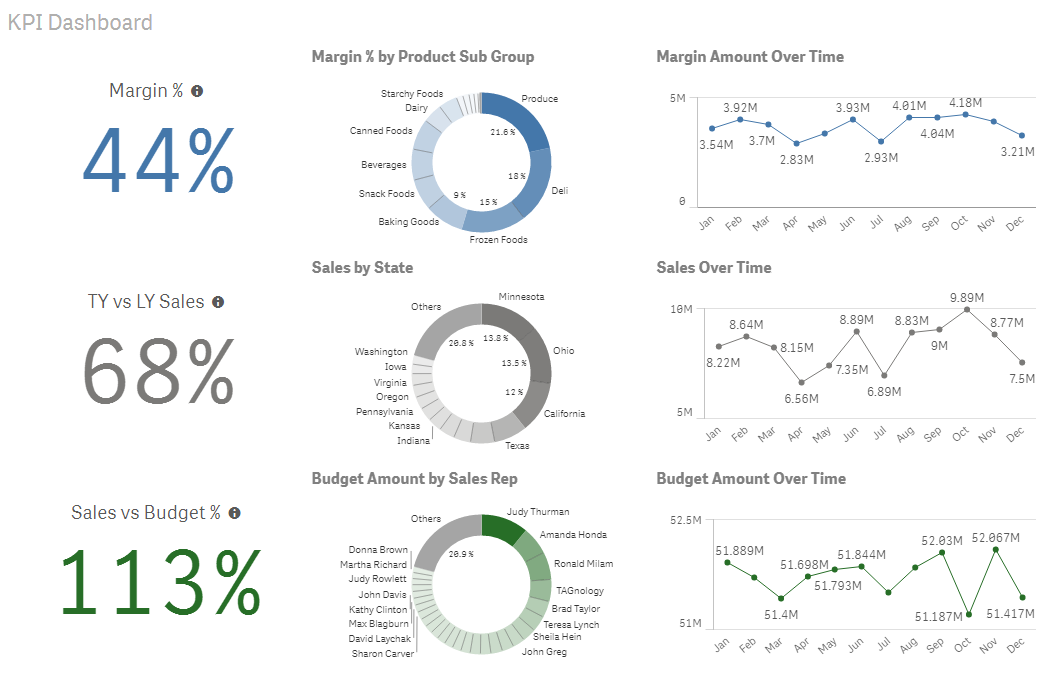
- Use color consistently – The Consumer Goods Sales demo does this nicely on the KPI Dashboard sheet by coloring all the margin charts in blue, the sales charts in gray and the budget charts in green. This sheet uses coloring to show what objects go together making it more intuitive for the user and guiding the user on how you would like them to read the charts on this sheet.
- Align objects on the sheet. With the grid, Qlik Sense does a good job at making it easy for users to keep objects aligned, organized and neat.
- Create Master Items to make your development easier as well as the development of any future editors of the app. Master Items provide one location for dimensions and measures that may need to be reused in the app. Add a quick description to measures that are a little more complicated.
- Add a Story to your app if there are some findings you would like to share with others or if you would like to document how you want users to use the app.
- Make sure the Data is right. Before sharing your app, just confirm that your data is accurate.
- Test on Smaller Devices if there is the chance that users may access your app from a tablet or mobile phone. Remember that with responsive design, objects will be organized from top to bottom, left to right. So if the sheet from Consumer Goods Sales (shown above) was viewed on a mobile device, the charts would be viewed in this order: margin KPI, margin pie chart, margin line chart, sales KPI, sales pie chart and so on. Michael Anthony wrote a blog on this topic that you may find useful.
Presented here are a few tips that can be taken to polish your Qlik Sense app before you share it with others. These tips take a few minutes to implement and can improve the user experience thus their understanding of the app. You should also check out Michael Anthony’s blog on UX Best Practices for Data Analysis. It provides a detailed overview of some topics I discussed such as color, mobile design, layout and so much more.
Thanks,
Jennell
- The first set of tips is around Descriptions – provide descriptions wherever you can to help users understand what they are viewing.
-
New Qlik Sense Certification Available!
The Qlik Sense Business Analyst Certification Exam is now available globally at Pearson VUE Test Centers!!For more information about the exam, visit http://www.qlik.com/us/services/training/certification/qlik-sense-analyst.This exam is the THIRD Qlik Sense Certification released - the other two are Qlik Sense System Administrator and Qlik Sense Data Architect. To learn more about Qlik certifications and read the FAQ visit the Certification web p... Show More
The Qlik Sense Business Analyst Certification Exam is now available globally at Pearson VUE Test Centers!!
For more information about the exam, visit http://www.qlik.com/us/services/training/certification/qlik-sense-analyst.
This exam is the THIRD Qlik Sense Certification released - the other two are Qlik Sense System Administrator and Qlik Sense Data Architect. To learn more about Qlik certifications and read the FAQ visit the Certification web pages: http://www.qlik.com/us/services/training/certification
We encourage all Qlik users to attend training, gain hands-on experience, and get certified! To register for your certification exam on the Pearson VUE web site. Go to http://www.pearsonvue.com/qlik
-
Can Technology Replace Teachers?
The way educators teach and students learn has changed dramatically over the last several years. One of the first companies to forge this change was Khan Academy, but have they proven that teachers are obsolete? Not just yet! To read more visit Can Technology Replace Teachers? | Qlik
-
See Qlik Sense APIs in action
The introduction of Qlik Sense APIs provided us with a flexible toolset to build, extend, and combine Qlik Sense with other technologies. The Qlik Sense APIs enable data to be freely exchanged between Qlik Sense and any web application, which means developers can build true data mashups with any web services or third-party library.If you are interested in understanding more in detail how the APIs work please check Qlik Sense Developers help and ... Show MoreThe introduction of Qlik Sense APIs provided us with a flexible toolset to build, extend, and combine Qlik Sense with other technologies. The Qlik Sense APIs enable data to be freely exchanged between Qlik Sense and any web application, which means developers can build true data mashups with any web services or third-party library.
If you are interested in understanding more in detail how the APIs work please check Qlik Sense Developers help and Francis or Yianni posts in this blog.
I’d like to show you some of the most recent projects we have been involved in that may motivate you to try out the Qlik Sense APIs.
Refugees’ journey in Europe
We partnered with The Telegraph to create a visualization that tries to help to answer questions such as, how many refugees are coming into Europe and what route do they take. The visualization piece is embedded as a part of a larger article at their online site.
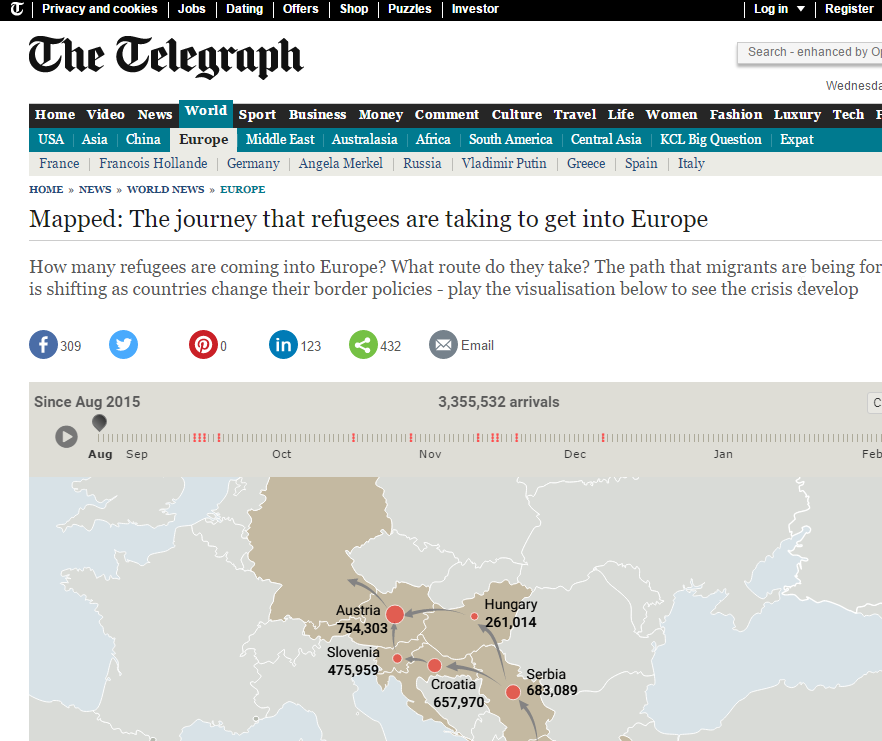
See it live here.
Visualizing survey data
We have worked on several surveys data visualization projects during the last months but I will pick two examples and I'm sure you will get the idea.
We built interactive pieces for their survey’s data adding the power of the associative engine to the survey's responses making it much more interesting, allowing us to filter the resultset to our particular interests.
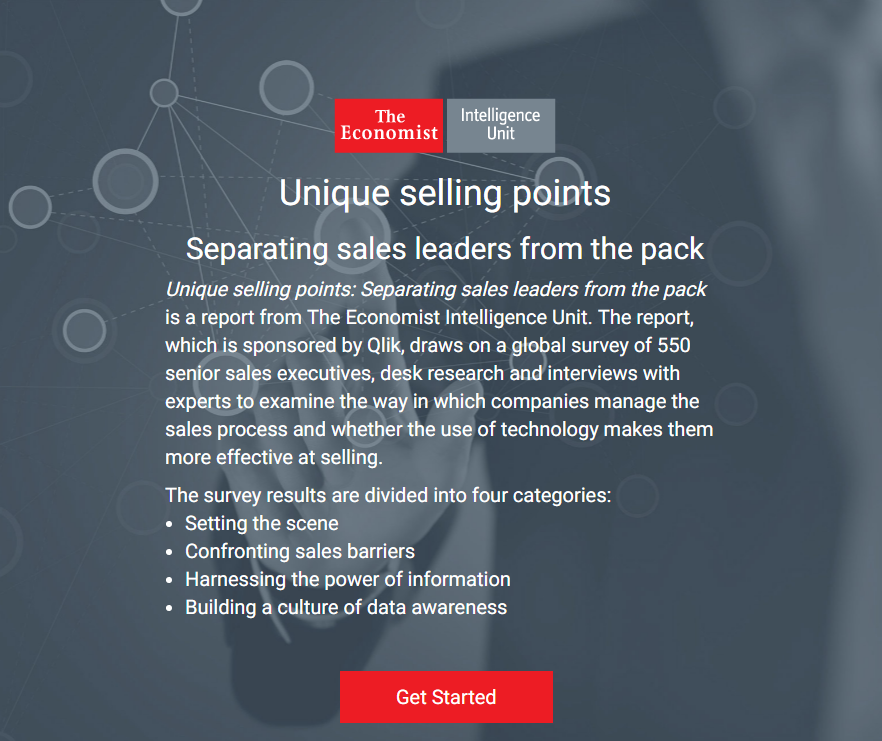
The Economist. Unique selling points. See it live here.
Forbes Insights. The agile, data-driven company. See it live here.
Which Airline is best for you
"When you’re buying a plane ticket, there’s a lot to consider: how much it costs, what time the flight leaves, whether there’s a layover—and which airline to fly." That's how Time Magazine introduced this piece that will help us, based on our own criterias, discover which airline fits you better.
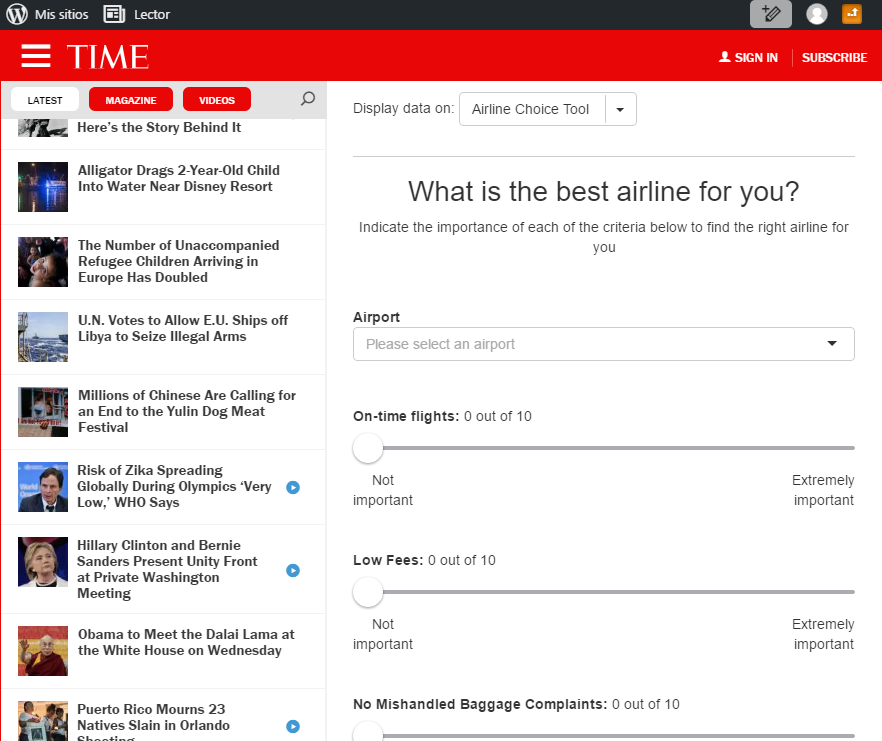
See it live here.
I hope you like these examples.
AMZ
-
The Importance of Nothing
Few things are as important to understand as the concept of nothingness. Or, rather, the fact that there are always many levels of nothingness. In physics, vacuum is the word used for nothingness. But whereas the best vacuum on earth contains billions of molecules per cubic meter, vacuum in outer space contains fewer than a dozen. So, these two vacua are completely different. And neither is really empty. What if we find some space completely ... Show MoreFew things are as important to understand as the concept of nothingness. Or, rather, the fact that there are always many levels of nothingness.
In physics, vacuum is the word used for nothingness. But whereas the best vacuum on earth contains billions of molecules per cubic meter, vacuum in outer space contains fewer than a dozen. So, these two vacua are completely different. And neither is really empty.
What if we find some space completely void of molecules? Would that represent nothingness? No, because the space would still be traversed by force fields, e.g., gravitation from distant stars. But space void of force fields, then? No, you would still have vacuum fluctuations, a quantum mechanical effect that can create particles from nothing. True nothingness may perhaps not exist. But one thing we know for sure is that there are levels of nothingness; one vacuum is not the same as the other.
In Lund there is a statue of Nothingness (Swedish: “Intighet”). There is nothing there, except the void of statue. But the statue’s existence is shown by a small plaque in the ground.

To complicate matters, there is a second plaque some centimeters away that announces that the statue has been stolen. The two plaques illustrate both the sense of humor in the student city of Lund and the universal existence of different levels of nothingness.
In databases and in QlikView, NULL is the word used for nothingness. But this is not the only type of nothingness. Also here you have different levels:
- The simplest representation of nothingness is the 0 (zero). But this is not true nothingness, since there is a numeric value in the field. The value will be used for calculations, e.g., it will affect both Count() and Avg(). So it is certainly not NULL.
- Another level of nothingness is the empty string. This may not be as obvious, but also this is a field value that affects the calculation of Count(). Hence still not NULL.
- The next level is the true NULL. This is when you have a record in the database, but there is no value for the specific field. This cell in the table is marked as NULL, meaning “a value is missing here.”
- The final level is when the entire record is missing. An example is if you have a customer table and an order table and a specific customer has not placed any orders. Then the customer is not represented in the order table and there is no table cell that can be marked as NULL. These are called Missing values and are treated the same as NULL values – when possible.
If you want to present data in a correct way and at the same time enable the user to search for missing values, e.g., customers that have not bought a specific product, you need to understand the different cases of nothingness. Nothing could be more important.
More on nothingness:
Excluding values in Set Analysis
Also, see more about this topic in this Technical Brief: NULL and Nothingness
-
Visualization API
The Visualization API is a cool new API introduced in Qlik Sense 2.2 that allows you to create visualizations right in javascript, removing the need to create visualizations in the Qlik Sense client before they can be used in a mashup. Here's a simple example, using the "Consumer Goods Sales" app.app.visualization.create('linechart',['Month', '=Sum([Sales Margin Amount])']).then(function(vis){ vis.show("QV01");}); This will create a line chart... Show MoreThe Visualization API is a cool new API introduced in Qlik Sense 2.2 that allows you to create visualizations right in javascript, removing the need to create visualizations in the Qlik Sense client before they can be used in a mashup.
Here's a simple example, using the "Consumer Goods Sales" app.
app.visualization.create('linechart',['Month', '=Sum([Sales Margin Amount])'])
.then(function(vis){
vis.show("QV01");
});
This will create a line chart with the one dimension, the "Month" field, and one measure, the expression "=Sum([Sales Margin Amount])". If you try this though, you'll notice that the y-axis label is equal to the expression, and you may want to name the label instead. In this case, we need to use the third, optional, parameter to the Visualization API create() method, which is an options object.
In the options object we can specify a qHyperCubeDef instead of using the second, optional, column parameter to the create() method. We also have to do it this way if we wish to use a custom Dimension or Measure created in the Qlik Sense client, as the column parameter will only accept field names and expressions. Here's an example
app.visualization.create('linechart',[],
{
qHyperCubeDef: {
qDimensions: [
{
qDef: {
qFieldDefs: [
"Month"
]
}
}
],
qMeasures: [
{
qDef: {
qDef: "Sum([Sales Margin Amount])",
qLabel: "Sales Margin"
}
}
],
qInitialDataFetch: [
{
qHeight: 12,
qWidth: 2
}
]
}
})
.then(function(vis){
vis.show("QV01");
});
Notice, we left the column parameter as a blank array. If you try to enter text into the column parameter array in addition to the including the qHyperCubeDef option, you may end up with an error.
You can set quite a few options like above, or you can use the Visualization API setOptions() method, which lets you change options on an already existing object. For instance, if we wanted the chart above to display sales over time instead of sales margin over time, we could update the hypercube with the setOptions() method, like below.
visRef.setOptions({
qHyperCubeDef: {
qDimensions: [
{
qDef: {
qFieldDefs: [
"Month"
]
}
}
],
qMeasures: [
{
qDef: {
qDef: "Sum([Sales Margin Amount])",
qLabel: "Sales Marginffff"
}
}
],
qInitialDataFetch: [
{
qHeight: 12,
qWidth: 2
}
]
}
})
Notice we called the setOptions() method on visRef, which is a reference to the vis object returned in the create() method callback.
This is really just scratching the surface of the possibilities of the Visualization API. Be sure to check it out!
-
A Closer Look at the Comparative Analysis
One of QlikView’s key differentiators is the associative experience, the ability for business users to easily navigate through data sets to not only find answers to their questions, but to also discover new insights, and spot hidden trends. Only QlikView provides business users with this level of flexibility and insight.Once the business users find a key insight or trend though, they might want to compare that with a slightly different view. For... Show MoreOne of QlikView’s key differentiators is the associative experience, the ability for business users to easily navigate through data sets to not only find answers to their questions, but to also discover new insights, and spot hidden trends. Only QlikView provides business users with this level of flexibility and insight.
Once the business users find a key insight or trend though, they might want to compare that with a slightly different view. For example, if they find that bike and accessory sales in Europe have flattened out over the last few quarters, they might wonder how that compares with the rest of Europe. Of course with QlikView they could immediately select the other European countries instead of France and immediately get the answer. But what if they wanted to see those two or more different views side by side?
One of the approaches that are used in those situations is using set analysis. With set analysis, it is possible to create data groups in charts and use them for visual comparison. The limitation of set analysis is the person creating set analysis should know about the type of groups that the other users would like to compare and set it up in advance accordingly.
QlikView 11 Comparative Analysis (Alternate State is the technical name of the feature) overcomes this challenge. The goal of Comparative Analysis is to make it easier and flexible for business users to see two or more data sets in the same application, alongside each other in the same graph, in graphs next to each other, or even as reference points for calculations and comparisons.
Comparative Analysis is a developer enabled capability, meaning developers need to set up the basic framework for comparison in an application. But it is a user-driven feature; meaning business users can then define the selections they want to compare. This video shows how to create alternate states, assign QlikView objects to them, and the concept of inheritance of alternate states. I will post about more creative ways of using alternate states in a couple of weeks, stay tuned!

-
String Operators
There are two string operators that can be used in Qlik Sense and QlikView. They are & (ampersand) and like. While I use the ampersand all the time, I have never used like before but I will start after learning how easy it is to use. The & operator is used to concatenate two strings. I often use this when I want to combine text and the results of a calculation in a chart title or Text and Image object. For example in the bar chart below from... Show MoreThere are two string operators that can be used in Qlik Sense and QlikView. They are & (ampersand) and like. While I use the ampersand all the time, I have never used like before but I will start after learning how easy it is to use. The & operator is used to concatenate two strings. I often use this when I want to combine text and the results of a calculation in a chart title or Text and Image object. For example in the bar chart below from the Executive Dashboard demo, this expression is used for the title:
'Total Revenue by Product Group = ' & num(Sum([Sales Quantity]*[Sales Price]), '$#,##0')
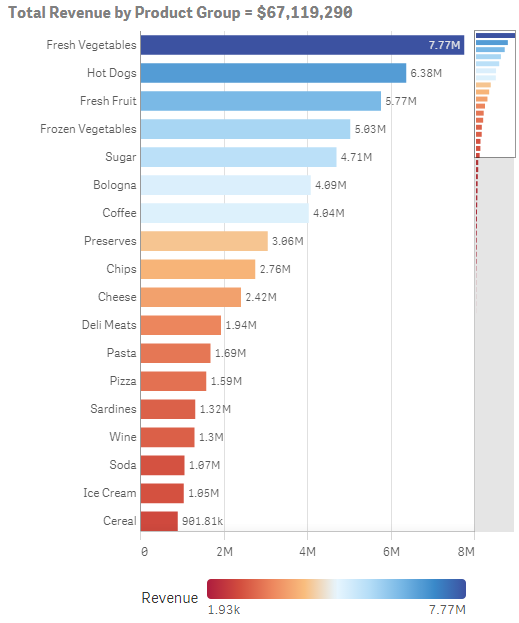
The expression uses the ampersand to concatenate the string 'Total Revenue by Product Group = ' and the results of the total revenue calculation: num(Sum([Sales Quantity]*[Sales Price]), '$#,##0') into one string. It will place the strings right after one another so do not forget to add spacing in between your strings if necessary.
The like operator has another purpose. It compares two strings using wildcard characters and returns the Boolean value of True if the string before the operator matches the string after the operator. The two wildcard characters that can be used in the string after the operator are * and ?. The * represents any number of characters while the ? represents only one character. Take a look at how this works in the examples below.
- ‘Qlik’ like ‘Q?ik’ will return True (-1) - the ? is a wildcard character for the ‘l’
- 'Qlik' like 'Q*' will return True (-1) - the * is the wildcard character for ‘lik’
- 'Qlik' like 'Q?k' will return False (0) – the ? is for a single character therefore it cannot represent the ‘l’ and the ‘i’
- 'Qlik' like 'Q??k' will return True (-1) – the first ? is the wildcard character for the ‘l’ and the second ? is the wildcard character for the ‘I’
The like operator can be used when you need to compare two strings that may vary slightly. Assume you have a full list of products that look like this:
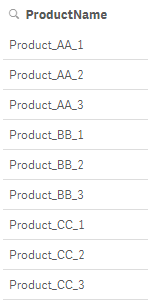
The like operator can be used to display products that start with ‘Product’ and end with the number 1.
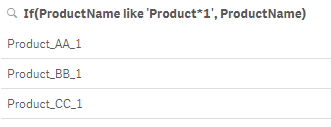
The expression below could also have been used returning all products that end in 1.
If(ProductName like '*1', ProductName)
Ampersand and like are string operators that can be used in charts and in the script to concatenate or compare strings. They are both binary operators meaning they take two operands. When using the & operator, each string on either side of the & is an operand. The same applies to the like operator with the operands being on each side of the like operator. Happy Qliking!
Thanks,
Jennell
-
New Profile Icons for Members
Hello Qlik Community Members,We have just installed some new profile icons to help identify specific members of the community more easily.You can see the icon next to the member’s avatar and on their profile page. If you mouse over the icon a brief descriptor will also display for you.Here are the new icons and their descriptors.Visual call outs for specific community members such as our Employee’s and Support team member help give a little more ... Show MoreHello Qlik Community Members,
We have just installed some new profile icons to help identify specific members of the community more easily.
You can see the icon next to the member’s avatar and on their profile page. If you mouse over the icon a brief descriptor will also display for you.
Here are the new icons and their descriptors.


Visual call outs for specific community members such as our Employee’s and Support team member help give a little more context to the resources they post and their responses to discussion threads. Members who are official Qlik Partners and Luminary program members also have new icons.
It’s always a good idea to follow and friend these types of members so you receive alerts for new content and have more opportunities to collaborate with Qlik experts.
Thanks for your participation in Qlik Community!

-
Autonumber function
Today I decided to blog about the Autonumber function that can be used to create a “compact memory representation of a complex key.” Having recently learned about this function, I realized there have been times in the past when this would have been helpful to use. For instance, when I need to build a link table in my data model, I often create keys that I use to link the tables. Sometime these key fields are lengthy and are a combination of 3 ... Show MoreToday I decided to blog about the Autonumber function that can be used to create a “compact memory representation of a complex key.” Having recently learned about this function, I realized there have been times in the past when this would have been helpful to use. For instance, when I need to build a link table in my data model, I often create keys that I use to link the tables. Sometime these key fields are lengthy and are a combination of 3 or 4 fields. In this blog, I will show you how you can use the Autonumber function to create a “compact memory representation of a complex key.”
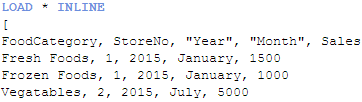
Assume I load a data set that looks like this:
And I want to load another data set that looks like this:
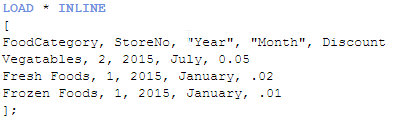
These two data sets have the same first four fields so if I were to load them as is, I would get a synthetic table in my data model. To avoid that I will set up a key field in each of the tables that includes the FoodCategory, StoreNo, Year and Month fields. This key field will be the field that links these two tables. I will do this using a preceding load when I load both of these tables. The script would look like this:
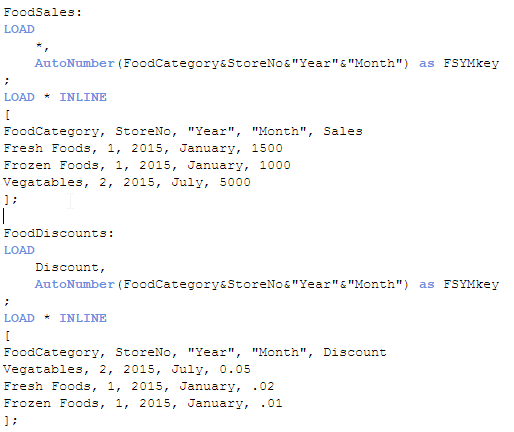
In the first table, I am using a preceding load to load all fields and then I am using the Autonumber function to create a key field that represents the four fields: FoodCategory, StoreNo, Year and Month. I am doing the same thing in the second table I am loading but the difference here is that I am not loading the key fields. By not loading the key fields, I am preventing a synthetic table from being loaded. The end result looks like this:
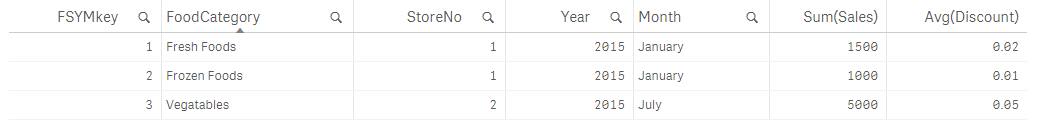
Notice the FSYMkey field. In this example, it is a unique integer that represents a larger expression. In the past, I would have created the key field like this (see the FSYMkey2 field in the table below):
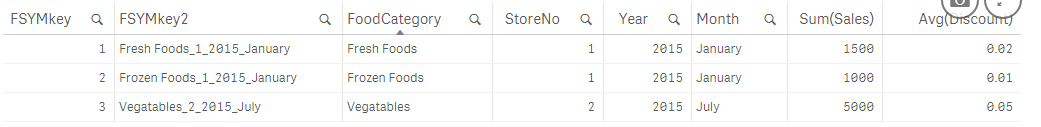
FSYMkey2 is a more complex field that would have taken up more memory. This example is small but if you had thousands of unique key fields like this, the consumed memory would add up. By using the Autonumber function, I was able to use an integer to represent a long string thus minimizing the memory usage in my app. This is one of many tricks that can be used to reduce the memory usage in your app. Henric Cronstrom has some other ideas in his Symbol Tables and Bit-Stuffed Pointers blog. Check it out.
Thanks,
Jennell


