Unlock a world of possibilities! Login now and discover the exclusive benefits awaiting you.
Product Innovation
By reading the Product Innovation blog, you will learn about what's new across all of the products in our growing Qlik product portfolio.
Support Updates
The Support Updates blog delivers important and useful Qlik Support information about end-of-product support, new service releases, and general support topics.
Qlik Academic Program
This blog was created for professors and students using Qlik within academia.
Community News
Hear it from your Community Managers! The Community News blog provides updates about the Qlik Community Platform and other news and important announcements.
Qlik Digest
The Qlik Digest is your essential monthly low-down of the need-to-know product updates, events, and resources from Qlik.
Qlik Learning
The Qlik Learning blog offers information about the latest updates to our courses and programs, as well as insights from the Qlik Learning team.
Recent Blog Posts
-
Augmented Analytics with the University of Liverpool
Last week the Qlik Academic Program ran an online session for the University of Liverpool for student studying a master’s in business analytics and big data. -
【オンデマンド配信】生成AI どう使う?ChatGPTの機能と限界と活用事例
5月21日に実施した無料Webセミナー、「生成AI どう使う?ChatGPTの機能と限界と活用事例~ChatGPTは歯科医師国家試験に合格するのか?~」をオンデマンドでご覧いただけます。 長年の Qlik Sense ユーザーである九州歯科大学の守下准教授は、ChatGPTを使って学生の成績アップを図れないかと考え、ChatGPTが学生の教育にどこまで利用できるかを国家試験問題を使って検証を行いました。結果は全問正解…だったでしょうか? 検証結果とそこから考えられる教育への応用と、生成AIの使用に対する課題をお話しいただきました。 九州歯科大学事務でのWhisper(OpenAIが文字起こしサービスとして公開した無料の音声認識モデル)を利用したDXの事例は、一般企業にとっても業務効率化のヒントになりそうです。 また、守下先生は、Qlik Sense を利用して常に医療情報データや学生の成績データを分析されています。実際の成績データの詳細分析による、勘や経験に頼らない効果的な教育カリキュラ... Show More5月21日に実施した無料Webセミナー、「生成AI どう使う?ChatGPTの機能と限界と活用事例~ChatGPTは歯科医師国家試験に合格するのか?~」をオンデマンドでご覧いただけます。
長年の Qlik Sense ユーザーである九州歯科大学の守下准教授は、ChatGPTを使って学生の成績アップを図れないかと考え、ChatGPTが学生の教育にどこまで利用できるかを国家試験問題を使って検証を行いました。結果は全問正解…だったでしょうか?
検証結果とそこから考えられる教育への応用と、生成AIの使用に対する課題をお話しいただきました。
九州歯科大学事務でのWhisper(OpenAIが文字起こしサービスとして公開した無料の音声認識モデル)を利用したDXの事例は、一般企業にとっても業務効率化のヒントになりそうです。
また、守下先生は、Qlik Sense を利用して常に医療情報データや学生の成績データを分析されています。実際の成績データの詳細分析による、勘や経験に頼らない効果的な教育カリキュラムの考案など、一般企業の人材育成にも通じる取り組みもあわせてご紹介いただきました。
動画は下記からご視聴いただけます。

-
Using Insight Advisor API in your Web App
We all know and love using Insight Advisor right within the Qlik Sense hub or inside Analytics apps, helping us analyze data, create visualizations or build data models. In this post, we will tap into the Insight Advisor API to leverage its power within a separate web application. We will create a simple web app that allows to ask natural language questions against our Qlik Sense app and get a recommended visualization as a response that we will ... Show MoreWe all know and love using Insight Advisor right within the Qlik Sense hub or inside Analytics apps, helping us analyze data, create visualizations or build data models.
In this post, we will tap into the Insight Advisor API to leverage its power within a separate web application.
We will create a simple web app that allows to ask natural language questions against our Qlik Sense app and get a recommended visualization as a response that we will then render using nebula.js
Pre-requisites:
You will need to grab the following before starting:- Qlik Cloud tenant URL
- Web Integration ID (you can get this from the Management console under Web, make sure to whitelist our localhost’s origin: http://localhost:1234)
- App Id
Installation
Run npm install to install the content of package.jsonFolder structure:
- src
- index.html (UI)
- index.js (main file)
- and cloud.engine.js (enigma.js library for engine session handling)
The following sections discuss the main parts of building the web app and calling the API, they are not in any particular order. I will provide the complete code for the project at the end of the post so you can see where everything fits.
1. Connecting to Qlik Cloud
First things first, we need to handle the authentication to Qlik Cloud.
Interactive login process:
async function getQCSHeaders() {
  await qlikLogin(); // enforce tenant login
  const response = await fetch(`${tenantUrl}/api/v1/csrf-token`, {
    mode: 'cors',
    credentials: 'include',
    headers: {
      'qlik-web-integration-id': webIntegrationId,
    },
  });

  const csrfToken = new Map(response.headers).get('qlik-csrf-token');
  return {
    'qlik-web-integration-id': webIntegrationId,
    'qlik-csrf-token': csrfToken,
  };
}

async function qlikLogin() {
  const loggedIn = await fetch(`${tenantUrl}/api/v1/users/me`, {
    mode: 'cors',
    credentials: 'include',
    headers: {
      'qlik-web-integration-id': webIntegrationId,
    },
  });
  if (loggedIn.status !== 200) {
    if (sessionStorage.getItem('tryQlikAuth') === null) {
      sessionStorage.setItem('tryQlikAuth', 1);
      window.location = `${tenantUrl}/login?qlik-web-integration-id=${webIntegrationId}&returnto=${location.href}`;
      return await new Promise((resolve) => setTimeout(resolve, 10000)); // prevents further code execution
    } else {
      sessionStorage.removeItem('tryQlikAuth');
      const message = 'Third-party cookies are not enabled in your browser settings and/or browser mode.';
      alert(message);
      throw new Error(message);
    }
  }
  sessionStorage.removeItem('tryQlikAuth');
  console.log('Logged in!');
  return true;
}
2. Communicating with the Qlik Cloud Engine
(content of the cloud.engine.js file)
We need to open a session using enigma.js to communicate with the Qlik QIX engine.
import enigma from "enigma.js";
const schema = require("enigma.js/schemas/12.1306.0.json");

export default class EngineService {
  constructor(engineUri) {
    this.engineUri = engineUri;
  }

  openEngineSession(headers) {
    const params = Object.keys(headers)
      .map((key) => `${key}=${headers[key]}`)
      .join("&");
    const session = enigma.create({
      schema,
      url: `${this.engineUri}?${params}`,
    });
    session.on("traffic:sent", (data) => console.log("sent:", data));
    session.on("traffic:received", (data) => console.log("received:", data));
    return session;
  }

  async closeEngineSession(session) {
    if (session) {
      await session.close();
      console.log("session closed");
    }
  }

  async getOpenDoc(appId, headers) {
    let session = this.openEngineSession(headers);
    let global = await session.open();

    let doc = await global.openDoc(appId);
    return doc;
  }
}
3. Including the Nebula Charts needed and rendering the recommended viz from Insight Advisor
When we eventually get back a recommendation from Insight Advisor, we will use a nebula object to embed it in our web app.
For a full list of available Nebula objects, visit: https://qlik.dev/embed/foundational-knowledge/visualizations/
We need to install “stardust” that contains the main embed function and all the nebula objects we need:
npm install @nebula.js/stardust

then install all objects needed
npm install @nebula/sn-scatter-plot
npm install @nebula/sn-bar-chart
etc...
import { embed } from '@nebula.js/stardust'; import scatterplot from '@nebula/sn-scatter-plot'; etc...Inside the rendering function, we will use stardust’s embed method to render the recommended chart type we get from Insight Advisor.
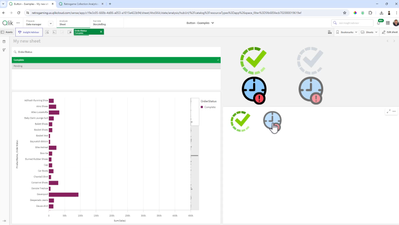
async function fetchRecommendationAndRenderChart(requestPayload) {
  // fetch recommendations for text or metadata
  const recommendations = await getRecommendation(requestPayload);

  const engineUrl = `${tenantUrl.replace('https', 'wss')}/app/${appId}`;
  // fetch rec options which has hypercubeDef
  const recommendation = recommendations.data.recAnalyses[0];
  // get csrf token
  const qcsHeaders = await getQCSHeaders();
  const engineService = new EngineService(engineUrl);
  // get openDoc handle
  const app = await engineService.getOpenDoc(appId, qcsHeaders);
  await renderHypercubeDef(app, recommendation);
}

async function renderHypercubeDef(app, recommendation) {
  const type = recommendation.chartType;

  const nebbie = embed(app, {
    types: [
      {
        name: type,
        load: async () => charts[type],
      },
    ],
  });

  document.querySelector('.curr-selections').innerHTML = '';
  (await nebbie.selections()).mount(document.querySelector('.curr-selections'));

  await nebbie.render({
    type: type,
    element: document.getElementById('chart'),
    properties: { ...recommendation.options }
});
4. Calling the Insight Advisor API for recommendations
You can either call the API with a natural language question or a set of fields and master items with an optional target analysis.
Insight Advisor API endpoints that can be called:
api/v1/apps/{appId}/insight-analyses
Returns information about supported analyses for the app's data model. Lists available analysis types, along with minimum and maximum number of dimensions, measures, and fields.api/v1/apps/{appId}/insight-analyses/model
Returns information about model used to make analysis recommendations. Lists all fields and master items in the logical model, along with an indication of the validity of the logical model if the default is not used.api/v1/apps/{appId}/insight-analyses/actions/recommend
Returns analysis recommendations in response to a natural language question, a set of fields and master items, or a set of fields and master items with an optional target analysis.
// Getting the recommendation
async function getRecommendation(requestPayload) {
  await qlikLogin(); // make sure you are logged in to your tenant
  // build url to execute recommendation call
  const endpointUrl = `${tenantUrl}/api/v1/apps/${appId}/insight-analyses/actions/recommend`;
  let data = {};
  // generate request payload
  if (requestPayload.text) {
    data = JSON.stringify({
      text: requestPayload.text,
    });
  } else if (requestPayload.fields || requestPayload.libItems) {
    data = JSON.stringify({
      fields: requestPayload.fields,
      libItems: requestPayload.libItems,
      targetAnalysis: { id: requestPayload.id },
    });
  }
  const response = await fetch(endpointUrl, {
    credentials: "include",
    mode: "cors",
    method: 'POST',
    headers,
    body: data,
  });

  const recommendationResponse = await response.json();
  return recommendationResponse;
}
Results:
For the complete example that includes calling the API with fields, master items, and a target analysis type, visit qlik.dev post: https://qlik.dev/embed/gen-ai/build-insight-advisor-web-app/
The full code for this post can be found here:
https://github.com/ouadie-limouni/insight-advisor-api
Make sure to change the variables in index.js.I hope you find this post helpful, please let me know if you have any question in the comment section below!
Ouadie -
Qlik Data Integration Client Managed May 2024 General Availability Release
As May brings Spring to a close and heralds the glimpse of summer, the days get a bit brighter and last longer. May seems full of new hope. Apart from Star Wars Day, which always occurs on May 4th (be with you), another galactic event that happens in May is our General Availability releases of both Qlik Replicate and Qlik Enterprise Manager. -
Dissecting the Engine API - Part 5: Multiple Hypercube Dimensions
My friend, Øystein Kolsrud - Software Architect at Qlik, is back with part 5 of the Qlik Engine API fundamentals: Multiple Hypercube DimensionsPrevious articles: Part 1: Let's Dissect the Qlik Engine API - Part 1: RPC Basics Part 2: Let's Dissect the Qlik Engine API - Part 2: Handles Part 3: Let's Dissect the Qlik Engine API - Part 3: Generic ObjectsPart 4: Let's Dissect the Qlik Engine API - Part 4: Hypercubes With part 5 of this series Øys... Show MoreMy friend, Øystein Kolsrud - Software Architect at Qlik, is back with part 5 of the Qlik Engine API fundamentals:
Multiple Hypercube DimensionsPrevious articles:
- Part 1: Let's Dissect the Qlik Engine API - Part 1: RPC Basics
- Part 2: Let's Dissect the Qlik Engine API - Part 2: Handles
- Part 3: Let's Dissect the Qlik Engine API - Part 3: Generic Objects
- Part 4: Let's Dissect the Qlik Engine API - Part 4: Hypercubes
With part 5 of this series Øystein will discuss some consequences of how the engine computes the data sets that hypercubes define.
Introduction
The hypercubes we have looked at so far were used to calculate multiple expressions for all values of a single field. We have seen how we in one go can compute both the sales, and the sales per month for all employees. Our next step will be to compute these statistics not only for the total set of data, but for sales per year as well. The data we have contains sales information for two different years, so if we want to calculate our expressions for a particular year, then we could simply select that year, and retrieve the data. The engine will do all the filtering for us and guarantee that only sales for the selected year is included in the hypercube computations. It is quite possible to use such a flow to iterate across the years in order to get sales information for each year, but as anyone who has ever added a table visualization to an app knows, there is a more efficient way to do this! We can simply extend the hypercube with the "Year" dimension, and have the engine do all the work for us!
How the engine deals with multiple dimensions
When the engine encounters multiple dimensions in a hypercube, it will compute the expressions for all possible combinations of values of the dimensions. Since our data contains information about sales for two employees from the years 2019 and 2020 we get the following set of four combinations:
"Amalia Craig", 2019
"Amalia Craig", 2020
"Amanda Honda", 2019
"Amanda Honda", 2020The hypercube definition we will use for our computations needs to contain two entries in the "qDimensions" array, like this:
{
  "jsonrpc": "2.0",
  "id": 21,
  "method": "SetProperties",
  "handle": 4,
  "params": [
    {
      "qInfo": {
        "qId": "3cb898dc-b7dc-44ed-ba83-c27fae5d0658",
        "qType": "myCube"
      },
      "qHyperCubeDef": {
        "qDimensions":
          [ { "qDef": { "qFieldDefs": [ "SalesRep"  ] } },
            { "qDef": { "qFieldDefs": [ "Year" ] } }
          ],
        "qMeasures":
          [ { "qDef": { "qDef": "Sum(Sales)" } },
            { "qDef": { "qDef": "Sum(Sales)/Count(Month)" } }
          ]
      }
    }
  ]
}
Now that we have added a second dimension, the resulting table will contain four columns (two dimensions, two measures), so in order to get all data, we need to set the width of the page ("qWidth") to 4:
{
  "jsonrpc": "2.0",
  "id": 22,
  "method": "GetHyperCubeData",
  "handle": 4,
  "params": [
    "/qHyperCubeDef",
    [ { "qLeft": 0,
        "qTop": 0,
        "qWidth": 4,
        "qHeight": 20
      }
    ]
  ]
}
The response will contain 4 rows with 4 cells each for a total of 16 cells (and I'll be truncating to reduce verbosity):
{
  "jsonrpc": "2.0",
  "id": 22,
  "result": {
    "qDataPages": [
      {
        "qMatrix": [
          [ { "qText": "Amalia Craig", ... },
            { "qText": "2019", ... },
            { "qText": "104480", ... },
            { "qText": "2749.4736842105", ... }
          ],
          [ { "qText": "Amalia Craig", ... },
            { "qText": "2020", ... },
            { "qText": "156662", ... },
            { "qText": "2701.0689655172", ... }
          ],
          [ { "qText": "Amanda Honda", ... },
            { "qText": "2019", ... },
            { "qText": "84396", ... },
            { "qText": "2482.2352941176", ... }
          ],
          [ { "qText": "Amanda Honda", ... },
            { "qText": "2020", ... },
            { "qText": "169293", ... },
            { "qText": "2821.55", ... }
          ]
        ],
        ...
      }
    ]
  }
}
And there you have it! The engine has computed our two expressions for both employees for both years!
The size of hypercubes
The data rows you get for a particular cube depends not only on the number of field values of the dimensions, but also on how those values relate to each other in the data model. Say for instance that "Amanda Honda" had no sales recorded for the year 2019 (perhaps because she was hired in 2020). The loaded data will then not contain any records associating "Amanda Honda" with the year "2019". When you get the data for the hypercube in this scenario, then there will only be three rows returned as the combination of the field values "Amanda Honda" and "2019" is excluded by the data.
You can check how many rows a hypercube has by looking at the property "qSize" of the hypercube layout. This is what the "GetLayout" response could look like in our case:
{
  "jsonrpc": "2.0",
  "id": 23,
  "result": {
    "qLayout": {
      "qInfo": {
        "qId": "3cb898dc-b7dc-44ed-ba83-c27fae5d0658",
        "qType": "myCube"
      },
      "qHyperCube": {
        "qSize": {
          "qcx": 4,
          "qcy": 3
        },
        "qDimensionInfo": [ ... ],
        "qMeasureInfo": [ ... ],
        ...
      }
    }
  }
}
The "qSize" property indicates both the number of columns ("qcx") and the number of rows ("qcy").
Excluded combinations
One might think that there should be a row generated also for combinations that do not have values. After all, one could without lying say that the sales for "Amanda Honda" in 2019 was 0. But this is not how the engine works! And that is a good thing! If the engine didn't do this type of filtering, then most cubes would result in such a large number of rows that they would be completely unusable. Consider for example that all sales transactions had both a timestamp and a unique ID associated with them. Then we create a hypercube that lists the timestamp, the ID, and the sales amount for each transaction represented in 1000 USD. We could define our cube like this:
"qHyperCubeDef": {

  "qDimensions":

    [ { "qDef": { "qFieldDefs": [ "Timestamp"  ] } },

      { "qDef": { "qFieldDefs": [ "ID" ] } }

    ],

  "qMeasures":

    [ { "qDef": { "qDef": "Sales/1000" } } ]

}
The number of rows this cube would yield would be equal to the number of IDs, as there is exactly one timestamp associated with each ID. Also, in this case it clearly makes no sense to return rows that show the sales for nonexistent combinations of "Timestamp" and "ID". In fact, if we did, then we would soon run into trouble. Imagine that there are 10 IDs. The resulting table would in that case contain 10*10=100 rows (if we assume that the timestamps are unique as well). If there were 1000 IDs then there would be a million rows. And if there were a million IDs then you'd better dive for cover and hope you don't bring down the entire engine when you try to compute the layout! Because the resulting number of rows would be astronomical!
It's good to be aware of this engine behavior as there are in fact cases where you risk creating such huge cubes. I have accidentally done so myself on several occasions. And I can tell you, it's not a good thing... The problem occurs when you add two fields to a cube that have no association to each other what so ever. A company could for instance have data for both sales and purchases, both of which have unique ID's, but are stored in different tables. Then I create a table visualization with timestamp and ID, but accidentally choose the ID from the "Purchases" table instead of from the "Sales" table like this:
"qHyperCubeDef": {

  "qDimensions":

    [ { "qDef": { "qFieldDefs": [ "Sales.Timestamp"  ] } },

      { "qDef": { "qFieldDefs": [ "Purchases.ID" ] } }

    ],

  "qMeasures":

    [ { "qDef": { "qDef": "Sales.Sales/1000" } } ]

}
Since all possible combinations of "Sales.Timestamp" and "Purchases.ID" are legal, this is likely to give me a hypercube of a rather intimidating size.
Summary
Hypercubes with multiple dimensions is a very common thing in Qlik Sense. Apart from the obvious example of a table visualization, most other visualizations allow for some form of multiple dimension configuration as well. Two examples that I frequently use are the bar chart and line chart visualizations, both of which will have cubes with multiple dimensions under certain configurations.
The handling of hypercubes is at the very core of how the engine deals with computations, but there are of course limits to what the engine can handle. If you run into surprisingly long computation times or very high engine memory usage, then be on the lookout for visualizations that accidentally span very large sets of field value combinations. Such cubes can sometimes give you nasty surprises.

-
Do..Loop
The do..loop control statement is used in the script to iterate through one or more statements until a condition is met. It is useful when you need to dynamically check a condition while executing statements in the script. There are two ways the do..loop can be used. The first is to check the condition before executing statement(s) in the loop and the second is to check the condition after the statement(s) in the loop have been executed. Let’... Show MoreThe do..loop control statement is used in the script to iterate through one or more statements until a condition is met. It is useful when you need to dynamically check a condition while executing statements in the script. There are two ways the do..loop can be used. The first is to check the condition before executing statement(s) in the loop and the second is to check the condition after the statement(s) in the loop have been executed. Let’s look at some examples.
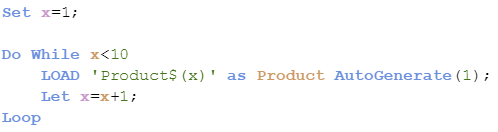
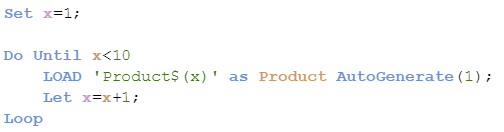
The script below checks to see if the condition has been met before the statements are executed. When x is no longer less than 10, the do..loop will stop.
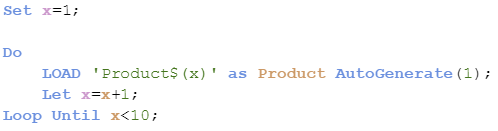
The script below is a little different. In this script, the condition is checked after the statements are executed so the statements will always run at least one time.
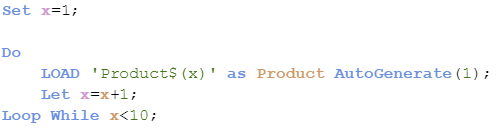
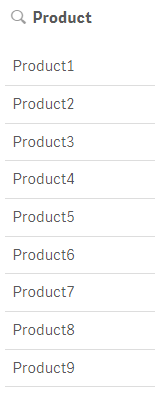
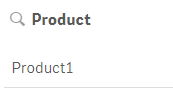
Both scripts produce the same results as seen below. Products 1 through 9 were created.
The do..loop also can be used with the “Until” keyword instead of the “While” keyword producing different results. In the script below, the statements will be executed until x is less than 10. Since x is equal to 1 which is less than 10, the statements never run so no products are generated.
Now if the condition is checked after the statements are run, as shown in the script below, one product will be created since the statements run once before the condition is checked.
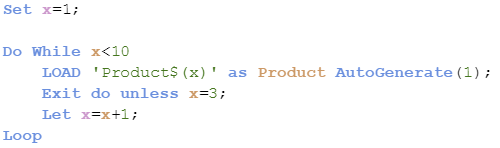
Now what if you need to exit the do..loop. You can do this using Exit do. The loop will be exited and execution will continue with the statement(s) following the loop. Here is an example of what this looks like. In the script below, the loop will exit after the Load statement runs 3 times, stopping when x is equal to 3.

In the script below, this loop will exit after the Load statement executes one time. Since x is not equal to 3, the loop will be exited when execution gets to the exit do statement.
The do..loop is helpful in the script when you need to execute statements while /until a condition is met. It provides flexibility since the condition can be dynamic and be evaluated before or after the statement(s) in the loop. This is a little different from the For..Next loop where a counter is used to determine the number of times the statement(s) in the loop are executed. Learn more about loops in Henric’s blog Loops in the Script.
Thanks,
Jennell
-
May Qlik Digest
Welcome to the May Qlik Digest featuring a rockin’ party at Qlik Connect, upcoming webinars, exciting learning promotions, and more! 3 reasons that’ll give you FOMO. 1. Customer Lightening Round A quick, fun, and energetic exploration into how successful global brands have conquered unique business challenges and found the opportunities in their data. Featuring Qlik customers: Penske Transportation Solutions: Sarvant “Rana” Singh, VP, Data & ... Show MoreWelcome to the May Qlik Digest featuring a rockin’ party at Qlik Connect, upcoming webinars, exciting learning promotions, and more!
3 reasons that’ll give you FOMO.
1. Customer Lightening Round
A quick, fun, and energetic exploration into how successful global brands have conquered unique business challenges and found the opportunities in their data.
Featuring Qlik customers: Penske Transportation Solutions: Sarvant “Rana” Singh, VP, Data & Emerging Technologies; and Anthony Arana, Director, Data Engineering and Business Intelligence
Vanguard: Glenn Wilkins, Sr. Enterprise Architect
Takeuchi: Susan Dean, Director of Business Technology
Genentech: Prashant Sahay, Analytics Director Technology
2. Qlik Ecosystem Discussion
Learn how to kick your data journey into high gear. Katie Linendoll and our strategic partners, AWS and Accenture, discuss how partner expertise enhances Qlik deployment
3. Data. Analytics. AI. And rides.
Are you registered for Qlik Connect? Beyond over 100 breakout sessions, 30+ certifications, and 60+ areas to explore on the show floor, you need to get ready for one of the biggest parties Qlik has ever thrown. We’ve reserved areas of Universal Islands of Adventure theme park just for you. Featuring themed lands and cutting-edge rides, Islands of Adventure promises excitement around every .
June 5 • 7:00 PM - 10:00 PM
New Qlik Learning Promotions!
Sometimes your work can’t wait for an upcoming class with in-person training. That’s why there’s the Qlik Continuous Classroom, our self-paced learning platform. It allows you to catch up on courses and assessments that match your role, style, and schedule. Redeem code SELFPACED20 for 20% off Qlik Continuous Classroom subscriptions. Explore the catalog here.
Or if you prefer traditional classroom training, where one of our expert instructors offers demonstrations and hands-on exercises, we are offering a discounted rate of 30% with code CLASSROOM30 on all public courses.
Use our course catalogue to find the right training course(s) for you.
Act fast, these codes expire on June 30th.
Look out for a new Qlik Learning experience!
Qlik has joined forces with Talend to bring you the very best of data analytics and integration, and now we're doing the same with your learning experience. Our new, integrated learning platform combines the best of both worlds, providing you with a one-stop-shop for all your training .
Take a moment to watch this sneak peek.
Do More with Qlik: Qlik Cloud Analytics Recap and Getting Started
May 29, 2024, at 10:00am EDT
Join Mike Tarallo, as he shows you how to quickly get started with Qlik Cloud. Mike will explain exactly what makes Qlik Sense the next-generation data exploration and visualization software, and make it easy for you to take action today.
Join Our Customer Survey: We Value Your Feedback!
We're excited to announce that we launched our semi-annual customer survey on May 27! This is your opportunity to share your thoughts and experiences with us, helping us better understand your needs and preferences.
If you haven’t already, make sure to check your inbox for our survey invitation!
-
BMW & Layout Container
BMW & Layout ContainerJOIN DATATesting layout container features.DiscoveriesNew possibilities with layout container featureImpactNew design to catch insightsAudienceDevelopersData and advanced analyticsDesign only -
Creating Visual Button Selections States
Ever wonder how those Qlik experts make those awesome interactive dashboards? It is easier than you think. Check out this video that quickly shows you how to create custom beautiful buttons to apply selections and visually represent an active or non-active selection state. Allowing users just another way to analyze data in a way that is easy and familiar.
-
Get discounted trainings and subscriptions!
Have you heard the news? Qlik Learning has launched a super exciting deal -
Switch Control Statement
The switch control statement is one of many controls statement that can used to determine the flow of the script. In Qlik Sense help, it is defined as: The switch control statement is a script selection construct forcing the script execution to follow different paths, depending on the value of an expression. Syntax:Switch expression {case valuelist [ statements ]} [default statements] end switch The switch control statement can be used in the sc... Show MoreThe switch control statement is one of many controls statement that can used to determine the flow of the script. In Qlik Sense help, it is defined as:
The switch control statement is a script selection construct forcing the script execution to follow different paths, depending on the value of an expression.
Syntax:
Switch expression {case valuelist [ statements ]} [default statements] end switch
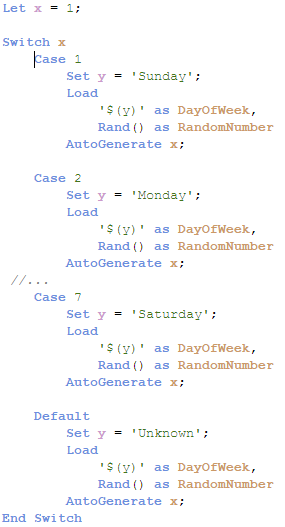
The switch control statement can be used in the script to identify a specific execution path. With the switch control statement, several paths can be defined and a default path can be defined as well when no match is found in the case clause. The various script paths cannot cross – they should be individual paths that do not overlap. In the script below, the expression x will be compared to each case. When there is a match, the script for that case will be executed.
In the example below, Case 1 will be executed – the variable y will be set to Sunday and one record will be generated in the table.
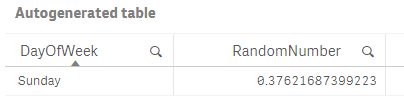
Below is a look at the record generated.
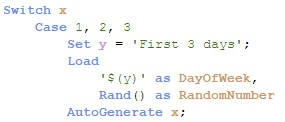
It is also possible to have more than one value for a case, for instance, you can use the script below to run the same script if x matches 1, 2 or 3.
When faced with various script execution paths, try using the switch control statement. While I rarely have a need to use it, I like how neat and straight-forward the syntax is. I have attached an example Qlik Sense app with the full script for you to test out for yourself.
Thanks,
Jennell
-
Watch Q&A with Qlik: Qlik Cloud Data Integration!
Don't miss our previous Q&A with Qlik! Hear from our panel of experts to help you get the most out of your Qlik experience. See the recording here! Our experts offered answers and creative solutions to your Qlik Cloud Data Integration questions.
-
-
Football_app
Football_appHapag-LloydI did this app not for work obviously. It shows some football stats, but with focus on how the fact if game was played on home stadium or away impacted the statistics(like goals, shots, ball possession etc)DiscoveriesIf team plays game at home, they score more, and win the games more oftenImpactIt didn't, I did it just for myself 🙂AudienceI showed it just to my Professor at my Business Informatics studies and my colleagues... Show MoreFootball_appHapag-Lloyd I did this app not for work obviously. It shows some football stats, but with focus on how the fact if game was played on home stadium or away impacted the statistics(like goals, shots, ball possession etc)
Discoveries
If team plays game at home, they score more, and win the games more often
Impact
It didn't, I did it just for myself 🙂
Audience
I showed it just to my Professor at my Business Informatics studies and my colleagues from the group. They liked it.
Data and advanced analytics
I used alternate states for it, to enable on one side of the dashboard to select games played at home, and on the second side games played away.
-
The As-Of Table
Last week I wrote about how the Above() function can be used for calculating rolling averages and other accumulations. There is however also an alternative method for doing the same thing:The As-Of table.When you use the Above() function, you fetch a number from other rows in a chart or Aggr() table. The As-Of table is slightly different in this respect: It is not a transient table created by an object or an expression – instead it is a real tabl... Show MoreLast week I wrote about how the Above() function can be used for calculating rolling averages and other accumulations. There is however also an alternative method for doing the same thing:
The As-Of table.
When you use the Above() function, you fetch a number from other rows in a chart or Aggr() table. The As-Of table is slightly different in this respect: It is not a transient table created by an object or an expression – instead it is a real table in the data model.
The idea is to create a secondary month field – the AsOfMonth - that links to multiple real months.
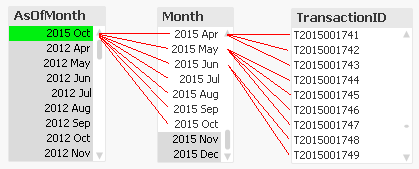
In the example above, you can see that ‘2015 Oct’ links to several preceding months, and each Month in turn links to several rows in a fact table. This means that a specific transaction will be linked to several AsOfMonths.
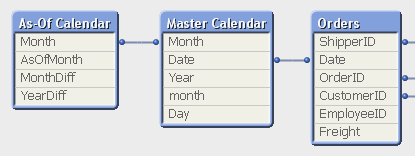
In the data model, the As-Of table should appear as a separate calendar table that links to the existing primary calendar table:
One way to create this table is the following:
First, make sure that you in your master calendar have a field “Month” that is defined as the first date of the month, e.g.
Date(MonthStart(Date),'YYYY MMM') as Month,
Then add the following lines at the end of the script:
// ======== Create a list of distinct Months ========
tmpAsOfCalendar:
Load distinct Month
Resident [Master Calendar] ;// ======== Cartesian product with itself ========
Join (tmpAsOfCalendar)
Load Month as AsOfMonth
Resident tmpAsOfCalendar ;// ======== Reload, filter and calculate additional fields ========
[As-Of Calendar]:
Load Month,
AsOfMonth,
Round((AsOfMonth-Month)*12/365.2425) as MonthDiff,
Year(AsOfMonth)-Year(Month) as YearDiff
Resident tmpAsOfCalendar
Where AsOfMonth >= Month;Drop Table tmpAsOfCalendar;
Once this table has been created, you can use the AsOfMonth as dimension in charts where you want rolling averages and accumulations.
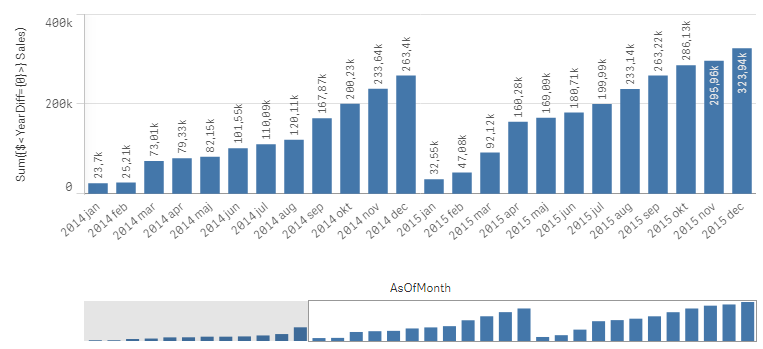
If you as measure use
Sum({$<YearDiff={0}>} Sales)
you will get a yearly accumulation – year-to-date up until the day of the script run.
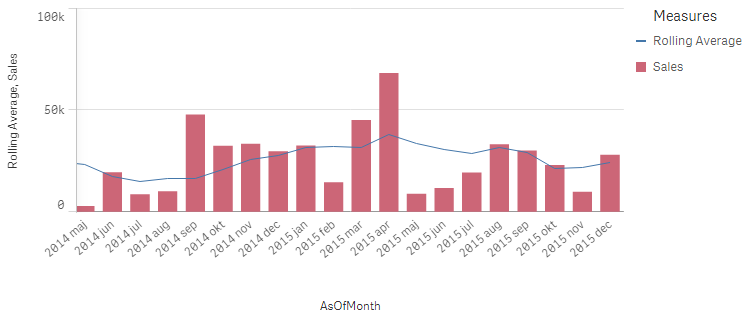
If you instead use
Sum({$<MonthDiff={"<6"}>} Sales) / Count(distinct {$<MonthDiff={"<6"}>} Month)
you will get a 6-month rolling average:
And finally, if you use
Sum({$<MonthDiff={0}>} Sales)
You will get the real, non-accumulated numbers.
I have made the Set Analysis expressions based on two fields: YearDiff and MonthDiff. However, for clarity it could be a good idea to add flags in the As-Of table, so that the Set Analysis expressions become even simpler, e.g.
If(MonthDiff=0,1,0) as IsSameMonth,
If(YearDiff=0,1,0) as IsSameYear,
If(MonthDiff<6,1,0) as IsRolling6,Summary: The As-Of table is a good way to calculate rolling averages and accumulations.
Further reading related to this topic:
Calculating rolling n-period totals, averages or other aggregations

-
Techspert Talks - Exploring Qlik Cloud Data Integration
Hi everyone, Want to stay a step ahead of important Qlik support issues? Then sign up for our monthly webinar series where you can get first-hand insights from Qlik experts. The Techspert Talks session from May looked at Exploring Qlik Cloud Data Integration. But wait, what is it exactly?Techspert Talks is a free webinar held on a monthly basis, where you can hear directly from Qlik Techsperts on topics that are relevant to Customers and Partne... Show MoreHi everyone,
Want to stay a step ahead of important Qlik support issues? Then sign up for our monthly webinar series where you can get first-hand insights from Qlik experts.The Techspert Talks session from May looked at Exploring Qlik Cloud Data Integration.
But wait, what is it exactly?
Techspert Talks is a free webinar held on a monthly basis, where you can hear directly from Qlik Techsperts on topics that are relevant to Customers and Partners today.In this session, we will cover:
- What it can do
- How it can be used
- Cloud Data Architecture
Click on this link to see the presentation
-
Anglia Ruskin University students boost employability skills with Qlik Academic ...
Check out our new success story about our collaboration with Anglia Ruskin University. -
Will we see you at Qlik Connect? (+ May enhancements)
Read more for the May enhancements in Qlik Community. -
生成AI どう使う?ChatGPTの機能と限界と活用事例~ChatGPTは歯科医師国家試験に合格するのか?~
5月21日の無料Webセミナーのご案内です。今回は、いつもの TechTalk と違って、Qlik の長年のユーザーである九州歯科大学の守下准教授をお招きします。守下先生は、電子カルテシステムの運営・管理を手掛け、電子カルテ・医事会計システムなどの医療情報データを Qlik Senseで分析し、病院経営に貢献されています。また学生の成績データをQlik Senseを通じて分析し、Institutional Research 活動も展開されています。 当日はインタビュー形式で、生成AIの進化と機能、実用例についてお話をお伺いする予定です。Qlik と組み合わせた使用方法についてもお伺いしたいと思っています。 守下先生は、これまでに大学経営、教育、病院運営にデータを活用する試みを多く取り組まれてきましたが、特に最近の注目すべき点として、ChatGPTがどのようにして歯科医師国家試験に回答したか、その結果と教育現場への応用可能性に焦点を当て、実践的な課題と洞察も共有いたします。 是非... Show More5月21日の無料Webセミナーのご案内です。
今回は、いつもの TechTalk と違って、Qlik の長年のユーザーである九州歯科大学の守下准教授をお招きします。守下先生は、電子カルテシステムの運営・管理を手掛け、電子カルテ・医事会計システムなどの医療情報データを Qlik Senseで分析し、病院経営に貢献されています。また学生の成績データをQlik Senseを通じて分析し、Institutional Research 活動も展開されています。当日はインタビュー形式で、生成AIの進化と機能、実用例についてお話をお伺いする予定です。Qlik と組み合わせた使用方法についてもお伺いしたいと思っています。
守下先生は、これまでに大学経営、教育、病院運営にデータを活用する試みを多く取り組まれてきましたが、特に最近の注目すべき点として、ChatGPTがどのようにして歯科医師国家試験に回答したか、その結果と教育現場への応用可能性に焦点を当て、実践的な課題と洞察も共有いたします。
是非みなさまご参加ください。
お申し込みはこちら